Updated
SUPER GCOV5 MAPSCALP > MAPPING & SCALPING
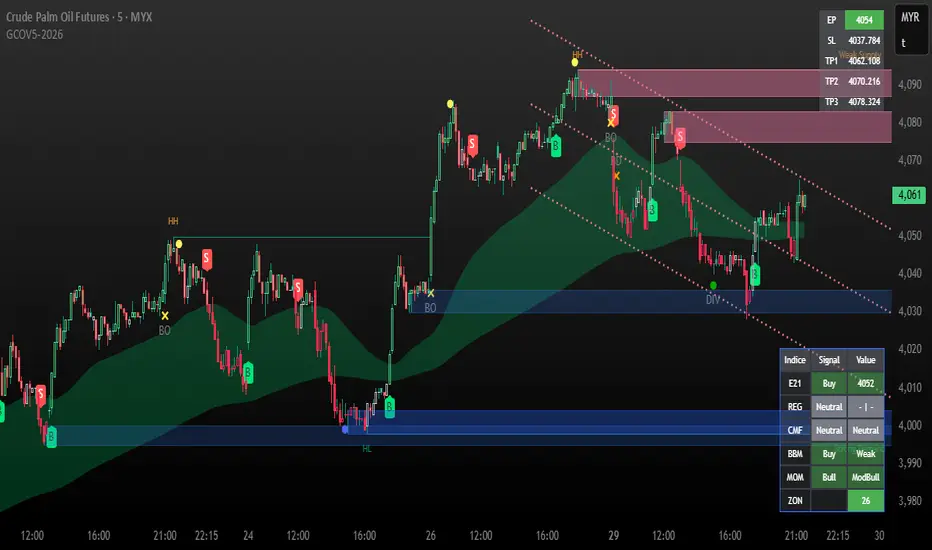
SUPER GCOV5 MAPSCALP indicator is built specifically for mapping/prediction measurement and fast trading i.e. scalping/intraday in the commodity market or cryptos market. It uses an indicator instrument consisting of ATR TRAILING STOP (ATR), EXPONENTIAL MOVING AVERAGE, PIVOT POINT, FIBONACCI KEY LEVEL, and LINEAR REGRESSION CHANNEL(LRC).
Rebuild of Instrument & Parameter
This indicator is also an upgraded instrument that is sourced from the previous indicator-FUTURES SCALPV2.This R&D of course makes trading activities more effective, and dynamic to increase the confidence of traders in current trading activities. The indicator has been upgraded in terms of parameters as well as additional instruments. Among them are;
1. ATR Trailing Stop
2. ATR BUY/SELL signal
3. Exponential Moving Average(EMA) – fastMA/slowMA Length
5. Breakout/breakdown signal
6. Pivot low/high level
7. Fibonacci extends & retracement
8. Linear Regression Channel(LRC)
9. Alert condition ( a dozen alerts )
>The best timeframe for entry is 3 minutes for FCPO and 15 minutes for other futures & cryptos.
>The best timeframe mapping/prediction is 1 hour & 4 hours.
>The candle/bars have been colored to make it easier for traders to see the price trends whether in bullish or bearish conditions.
Easier SOP of ENTRIES/POSITIONING:
1. entry by signal BUY/SELL after signal bar ( 2nd bar) for confirmation.
2. The best entries BUY at support(pivot low-Blue line) after price rebound then signal appears. The best buy also when the price is at lower
low pivot + fibo support level + lower trendline(LRC) + and the price went rebound.
3. The best entries SELL at resistance(pivot high-red line) after price pullback then signal appears.
The best buy also when the price is at a higher high pivot + fibo resistance level + upper trendline LRC + and the price went pullback.
4. Profit-taking areas are usually measured by support and resistance levels. Please refer to the bold line( support & resistance), fibo key level,
and trendline.
*To avoid false signals/wrong positions, you can use the EMA line as a guide and follow the trends, which are the buying weight when the price is above the 20/50 ema, and the selling weight when the price is below the 20/50 ema. EMA can be reset on the input setting.
STEPS of MAPPING/PROJECTION:
1. Use a bigger timeframe such as 4 hours or 1 hour
2. Use LRC to identify buy/sell weights when the price makes a zig-zag patent
3. Use monthly and weekly fibo levels to know support and resistance. This fibo is very important to see if the price will make an extension or
retracement based on the regression channel earlier. So here we can evaluate which area to buy/sell/take-profit/exit and the reversal of a
market price.
You can also create an ALERT CONDITION to help you get a reminder of signals and price trend changes
The original instrument has been retained but changed in terms of display & facelift features.
Hopefully, the new one will assist you in making analysis and strategy of trading activities successfully.
THIS IS NOT A BUY/SELL CALL, ONLY STUDY IDEAS AND ANALYSIS BASED ON MEASUREMENT TOOLS FOR EDUCATION AND GUIDANCE PURPOSES.PLEASE TAKE AT YOUR OWN RISK.
Rebuild of Instrument & Parameter
This indicator is also an upgraded instrument that is sourced from the previous indicator-FUTURES SCALPV2.This R&D of course makes trading activities more effective, and dynamic to increase the confidence of traders in current trading activities. The indicator has been upgraded in terms of parameters as well as additional instruments. Among them are;
1. ATR Trailing Stop
2. ATR BUY/SELL signal
3. Exponential Moving Average(EMA) – fastMA/slowMA Length
5. Breakout/breakdown signal
6. Pivot low/high level
7. Fibonacci extends & retracement
8. Linear Regression Channel(LRC)
9. Alert condition ( a dozen alerts )
>The best timeframe for entry is 3 minutes for FCPO and 15 minutes for other futures & cryptos.
>The best timeframe mapping/prediction is 1 hour & 4 hours.
>The candle/bars have been colored to make it easier for traders to see the price trends whether in bullish or bearish conditions.
Easier SOP of ENTRIES/POSITIONING:
1. entry by signal BUY/SELL after signal bar ( 2nd bar) for confirmation.
2. The best entries BUY at support(pivot low-Blue line) after price rebound then signal appears. The best buy also when the price is at lower
low pivot + fibo support level + lower trendline(LRC) + and the price went rebound.
3. The best entries SELL at resistance(pivot high-red line) after price pullback then signal appears.
The best buy also when the price is at a higher high pivot + fibo resistance level + upper trendline LRC + and the price went pullback.
4. Profit-taking areas are usually measured by support and resistance levels. Please refer to the bold line( support & resistance), fibo key level,
and trendline.
*To avoid false signals/wrong positions, you can use the EMA line as a guide and follow the trends, which are the buying weight when the price is above the 20/50 ema, and the selling weight when the price is below the 20/50 ema. EMA can be reset on the input setting.
STEPS of MAPPING/PROJECTION:
1. Use a bigger timeframe such as 4 hours or 1 hour
2. Use LRC to identify buy/sell weights when the price makes a zig-zag patent
3. Use monthly and weekly fibo levels to know support and resistance. This fibo is very important to see if the price will make an extension or
retracement based on the regression channel earlier. So here we can evaluate which area to buy/sell/take-profit/exit and the reversal of a
market price.
You can also create an ALERT CONDITION to help you get a reminder of signals and price trend changes
The original instrument has been retained but changed in terms of display & facelift features.
Hopefully, the new one will assist you in making analysis and strategy of trading activities successfully.
THIS IS NOT A BUY/SELL CALL, ONLY STUDY IDEAS AND ANALYSIS BASED ON MEASUREMENT TOOLS FOR EDUCATION AND GUIDANCE PURPOSES.PLEASE TAKE AT YOUR OWN RISK.
Release Notes
Major updates;1. signal B lime & S red parameter improvements > stabilize signals if the price is in a sideways trend.
2. added VWAP longshort signals for scalping pullback during uptrend/downtrend > blue/red label.
3. technical and entry set-up for buy/sell is still the same as before, only the signal coordinate changes.
4. For VWAP entries set-up please refer to the image below.
*Please refresh your tradingview, or close the existing GCOV5 and reinstall / apply again
Parameter improvement & VWAP scalping signal
All of these combinations can help you make a quick decision
How does its work
VWAP entry set-up
Release Notes
Re-install pivot SnRRelease Notes
Please turn off the current one and apply it to the chart again,1. change the multiplier & period signal for stabilization
2. added exit signal and alert for swing = Swing EX
* you can hide anyone unnecessary in your chart for a clean look in the setting inputs > inputStyle
Release Notes
Major updatesGCOV5 PREMIUM- NOV23
Update list;
1. Added SUPPLY & DEMAND (SND) KEYLEVEL
2. Insert a trends cloud- easy to identify current trends
3. input divergence and reversal signals
4. trading figures – entry price, stop-loss, take profit
5. variables panel – condition and trends
BEFORE…
AFTER…
FEATURES OF INDICATOR
TRADING SET-UP
SOPs WEIGHTED POSITIONS EITHER BUY/SELL FOR ALL SIGNALS ( buy/sell scalping, Divergences, Reversal point)
SOPs entries/position
( applies to all signals- B / S, Reversal, and Divergence )
1. Position weighted based on trend cloud & SND
2. Entry only if the price is in the supply & demand zone( SND )
Buy = at demand
Sell = at supply
3. Wait for the candle to be ready and enter the close price
of the signal bar.
ENTRY TRADING – buy (B) & sell (S) signals
Time frame = 3 minutes & 5 minutes
The settings for stop loss and take profit are as follows;
SL = 0.4 % ( 15 ticks )
TP1 = 0.2 % ( 7 ticks )
TP2 = 0.4 % ( 15 ticks )
TP3 = 0.6 % ( 23 ticks )
*other markets, etc cryptos, soy, and crude oil, must reset the input of SL/TP percent( % )
because the price value difference causes the percentage value to be different.
REVERSAL & DIVERGENCE SIGNALS
a) This reversal zone is indicated by a blue circle signal for reversal-up and a
yellow signal circle for reversal-down.
b) This signal is an entry signal when this signal is in the Supply (sell) zone
and the Demand (buy) zone.
c) The SOP is to enter the position when the signal is triggered in the supply
& demand zone.
d) Signal Divergence is indicated by a green DIV circle signal for bullish
divergence and a red DIV circle for bearish divergence.
e) The SOP is the same as the reversal signal, position entry when the
signal is triggered in the supply & demand zone.
ACCURACY / WINNING RATES
This result is based on a historical algorithm test by B & S signals from the date 09 Oct - 22 Oct 2023, using a time frame of 3 minutes and 5 minutes.
Timeframe = 5 minutes
Signals = 24
Hits SL = 6
Hits TP = 18 [ TP1= 5, TP2= 4, TP3= 9 ]
% Win = 75%
Timeframe = 3 minutes
Signals = 38
Hits SL = 11
Hits TP = 27 [ TP1= 10, TP2= 3, TP3= 14 ]
% win = 71.05%
*The rate can reach up to 80-85% if we follow the position-weighted SOPs
For the complete manual and SOP please refer to the published video on my YouTube
Dear users, to apply the new update, go to “invite-only script” and click on the name of the indicator again. So that’s been done.
Hope it’s useful and have a good trade.
Release Notes
Move the table into vertical to optimize the screenRelease Notes
fix some errors,> for some markets, the indicator cannot be analyzed when using a small time frame (eg 3m for HSI futures), so now it has been fixed (reset), and it's done.
*so far/previously this error has not happened to other markets.
only those of you who are involved please re-apply the indicator.
Release Notes
Set options for trading panel label sizes;table size can be customised according to user preference > options > ‘tiny’, “small”, ‘normal’
Release Notes
Update notes- indicator strategy panel;=== Setting input for dashboard ===
Now user can apply option for dashboard size, location, and toggle ON/OFF.
=== Indicator Dashboard ===
📌 EMA21 (Exponential Moving Average 21)
Function: Tracks short‑term trend direction by comparing price to the 21‑period EMA.
📌 REGIME (Market Regime Tracker)
Function: Identifies whether the market is trending bullish, bearish, or sideways using momentum and MACD slope.
1. Strength labels (“Strong/Weak”) show confidence in the regime.
2. Bullish regime → favor long trades.
3. Bearish regime → favor short trades.
📌 CMF (Chaikin Money Flow – Volume Pressure)
Function: Measures buying vs. selling pressure using price and volume flow.
How to use:
VH/H/Mod Buy → strong to moderate accumulation, supports long entries.
VH/H/Mod Sell → strong to moderate distribution, supports short entries.
Neutral → no clear volume bias.
📌 BBMacd (Bollinger Band MACD)
Function: Combines MACD with Bollinger Bands to detect momentum breakouts.
How to use:
Strong Buy/Sell → large deviation from average, high conviction signal.
Moderate Buy/Sell → smaller deviation, weaker signal.
Neutral → no clear breakout, wait for confirmation.
📌 MOM (Momentum Oscillator – Awesome Oscillator)
Function: Measures short‑term momentum shifts using median price differences.
How to use:
Strong Bull/Bear → aggressive trend continuation.
Moderate Bull/Bear → softer momentum, watch for confirmation.
Neutral → no momentum edge, avoid chasing trades.
📌 ZONE Take Profit
Function: Flags extreme zones (overbought/oversold) where price may hit resistance or support targets.
How to use:
R/TP → potential reversal or take‑profit zone.
Use to lock in profits or prepare for counter‑trend setups.
Best applied after strong trend signals to secure gains.
=== Dynamic shading ===
How to use each tool (with color shading),mirrors the dashboard’s shading logic:
Solid green/red = very strong buying/selling.
Medium green/red = high buying/selling.
Light green/red = moderate/weak buying/selling.
Gray = neutral/no bias.
Yellow = take profit/exit zones
Release Notes
fix the red sell EP color on trading panel,Release Notes
“Minor Update: Bug Fixes and Corrections in the Trading Panel”Issue: Trading panel displays opposite signal compared to prime chart.
Resolved;

Disclaimer
The information and publications are not meant to be, and do not constitute, financial, investment, trading, or other types of advice or recommendations supplied or endorsed by TradingView. Read more in the Terms of Use.
Disclaimer
The information and publications are not meant to be, and do not constitute, financial, investment, trading, or other types of advice or recommendations supplied or endorsed by TradingView. Read more in the Terms of Use.