COT Hedger Positioning Extremes
█ OVERVIEW
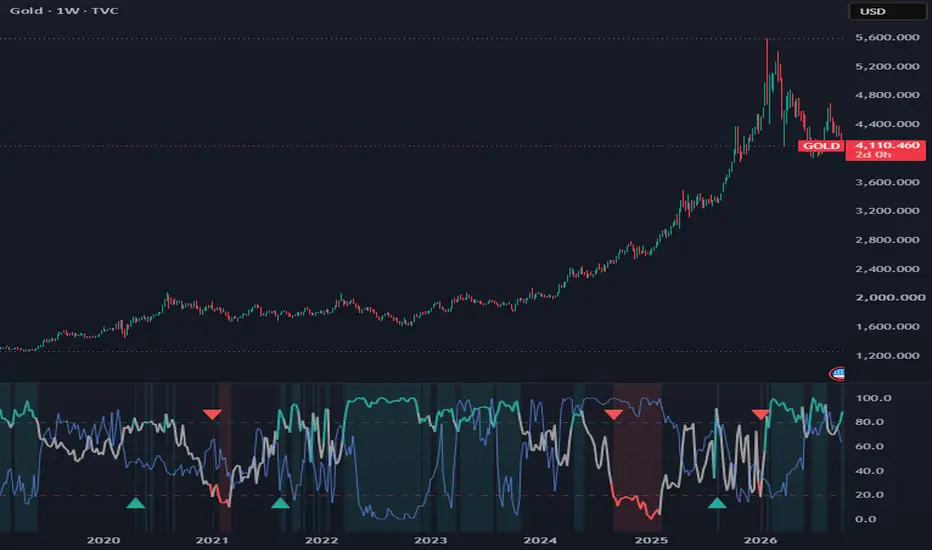
This indicator ranks hedger positioning from the CFTC Commitment of Traders Disaggregated report against its own history and marks the weeks when that positioning enters an extreme band. It also records what the chart symbol did after each past entry, so you can see how the reading has behaved on the contract you are charting.
Hedgers here means the Producer/Merchant/Processor/User category: entities the CFTC classifies as producing, processing or handling the physical commodity and using futures to hedge that business. An optional setting adds Swap Dealers, which approximates the Legacy report's Commercial category.
The approach follows the COT Index associated with Larry Williams, which reads a hedger position near the top of its multi-year range as a contrarian bullish condition and a position near the bottom as a contrarian bearish one. This script does not assume that reading holds. The forward-return panel described below lets you check it on your own chart.
═══════════════════════════════════════
█ HOW IT IS CALCULATED
Hedger net is hedger long positions minus hedger short positions. The script divides hedger net by open interest, so the reading is a share of the market instead of a contract count. Raw contract counts drift as open interest grows or shrinks over the years, and ranking them partly ranks that drift.
Each week the script computes a percentile rank: the share of the previous 156 weekly readings at or below the current one. A rank of 90 means the current reading is at or above 90 percent of the prior three years of readings. Hedgers in most physical markets are net short, so a high rank usually means hedgers are less short than usual, not that they are net long.
The script uses a percentile rank instead of min-max scaling. Under min-max scaling a single outlier week compresses every other reading for as long as it stays in the window. A rank is not affected that way.
Managed Money net is calculated the same way and plotted as a second line for context. It does not affect zones, events or alerts.
═══════════════════════════════════════
█ ZONES AND EVENTS
The main line is the hedger percentile. It is green in the upper zone, red in the lower zone and gray between them.
Upper zone: hedger percentile at or above 80 with default settings. Hedger net, as a share of open interest, is near the top of its range for the lookback window.
Lower zone: hedger percentile at or below 20 with default settings. Hedger net is near the bottom of its range.
A triangle at the bottom of the pane marks an entry into the upper zone. A triangle at the top marks an entry into the lower zone. An entry counts only after the line has spent at least 26 weeks outside that zone. A reading that slips out of a zone and returns a few weeks later does not produce a second marker or a second alert. Alerts fire on the same two events.
═══════════════════════════════════════
█ FORWARD-RETURN PANEL
For each marked entry, the script records the chart symbol's return from the open of the following week to the close 13 weeks and 26 weeks after the entry week. Entry at the following open avoids assuming a fill in the week the report was released.
The panel shows the episode count, median return and share of positive returns for upper-zone entries, lower-zone entries, and every week with a valid reading. The all-weeks rows are the baseline: compare each zone's figures against them, not against zero. A row with fewer than 5 episodes shows "few" in place of statistics.
The panel is in-sample and descriptive. It runs no significance test, episode counts are small with default settings, and the all-weeks baseline uses overlapping windows. Treat it as a check on the reading, not as evidence that the reading has predictive value.
═══════════════════════════════════════
█ DASHBOARD
The dashboard shows the zone state, the active CFTC code with report and options setting, the hedger group, hedger and Managed Money net as a percent of open interest, both percentiles, and data age. Data age is the number of weeks since open interest last changed. The cell turns orange at 2 weeks or more, which flags a delayed report.
═══════════════════════════════════════
█ SETTINGS
Hedger group: Producer/Merchant, or Producer/Merchant plus Swap Dealers.
Include options: futures and options combined, or futures only.
COT futures contract: optional. Pick the futures contract whose report to read, for example ICEUS:SB1! for sugar. Left blank, the script uses the chart's own futures contract on CME, CBOT, NYMEX, COMEX or ICE US. On common spot and CFD symbols, and on unleveraged single-commodity ETFs that hold the commodity or its futures, such as XAUUSD, GLD, USO and CANE, it reads the futures report for the same commodity. Any other chart shows a centered prompt until a contract is picked.
CFTC code override: optional. A six-character CFTC code, such as 088691 for gold, takes priority over the contract setting and the chart. Examples: 088691 gold, 084691 silver, 085692 copper, 067651 WTI crude.
Percentile lookback: 156 weeks by default.
Extreme band width: 20 by default, which places the upper zone at 80 and above and the lower zone at 20 and below.
Episode separation: 26 weeks by default.
Short and long horizon: 13 and 26 weeks by default.
Minimum episodes: 5 by default.
Show dashboard and Show forward-return panel: both off by default. Turn them on in the Display and Forward-return panel groups.
═══════════════════════════════════════
█ LIMITATIONS
Weekly charts only. On any other timeframe the script plots nothing, fires no alerts and shows a centered warning to switch to 1W. COT data is weekly, and every window in the script is counted in weekly bars.
Physical commodities only. The Disaggregated report does not cover financial futures such as equity index, interest rate or currency contracts. The script shows a message when no data returns for the selected code.
CFTC-reported exchanges only. Futures on other exchanges, such as Brent on ICE Futures Europe, show a prompt instead of data. Equity ETFs such as oil and gas producer funds, and leveraged or inverse commodity ETFs, are not mapped to any commodity report.
Report timing. Positions are as of Tuesday and published the following Friday afternoon. Holidays and government shutdowns have delayed releases by days to weeks. Historical data shows each report at its as-of date, not the date it became public, so past readings include information that was not available in real time during those delays.
Roll gaps. Forward returns on an unadjusted continuous contract include the price gaps at each contract roll. Enable back-adjustment for continuous futures in the chart settings before reading the panel, particularly on energy contracts.
Positioning moves with price. In many physical markets, hedger net moves opposite to price from week to week, because hedgers add shorts into rallies and reduce them into declines. A zone entry often follows a large price move that has already happened.
Relative reading. A percentile describes where the current reading sits within the lookback window. A market whose positioning has shifted structurally can stay in one zone for long stretches.
History. Disaggregated data begins in 2006, and the first readings appear only after the lookback fills, about three years later with default settings.
Mapped and overridden symbols. On a spot, CFD or ETF chart, the positioning shown is the futures market's, and the forward-return panel measures the chart symbol, including any ETF roll and fee drag. When the override points at a different contract than the chart, the panel still measures the chart symbol.
═══════════════════════════════════════
█ ORIGINALITY
TradingView's built-in Commitment of Traders indicators display report metrics directly, and many published COT Index scripts rescale Legacy commercial or speculator net positions with min-max scaling. This script differs in four ways. It isolates the physical hedger category with Disaggregated data instead of the Legacy Commercial category, which also contains swap dealers. It normalizes by open interest before ranking. It uses a percentile rank and de-clusters zone entries so each episode counts once. It measures the chart symbol's return after each entry against an all-weeks baseline on the same chart.
COT tickers are built with TradingView's LibraryCOT library.
This indicator ranks hedger positioning from the CFTC Commitment of Traders Disaggregated report against its own history and marks the weeks when that positioning enters an extreme band. It also records what the chart symbol did after each past entry, so you can see how the reading has behaved on the contract you are charting.
Hedgers here means the Producer/Merchant/Processor/User category: entities the CFTC classifies as producing, processing or handling the physical commodity and using futures to hedge that business. An optional setting adds Swap Dealers, which approximates the Legacy report's Commercial category.
The approach follows the COT Index associated with Larry Williams, which reads a hedger position near the top of its multi-year range as a contrarian bullish condition and a position near the bottom as a contrarian bearish one. This script does not assume that reading holds. The forward-return panel described below lets you check it on your own chart.
═══════════════════════════════════════
█ HOW IT IS CALCULATED
Hedger net is hedger long positions minus hedger short positions. The script divides hedger net by open interest, so the reading is a share of the market instead of a contract count. Raw contract counts drift as open interest grows or shrinks over the years, and ranking them partly ranks that drift.
Each week the script computes a percentile rank: the share of the previous 156 weekly readings at or below the current one. A rank of 90 means the current reading is at or above 90 percent of the prior three years of readings. Hedgers in most physical markets are net short, so a high rank usually means hedgers are less short than usual, not that they are net long.
The script uses a percentile rank instead of min-max scaling. Under min-max scaling a single outlier week compresses every other reading for as long as it stays in the window. A rank is not affected that way.
Managed Money net is calculated the same way and plotted as a second line for context. It does not affect zones, events or alerts.
═══════════════════════════════════════
█ ZONES AND EVENTS
The main line is the hedger percentile. It is green in the upper zone, red in the lower zone and gray between them.
Upper zone: hedger percentile at or above 80 with default settings. Hedger net, as a share of open interest, is near the top of its range for the lookback window.
Lower zone: hedger percentile at or below 20 with default settings. Hedger net is near the bottom of its range.
A triangle at the bottom of the pane marks an entry into the upper zone. A triangle at the top marks an entry into the lower zone. An entry counts only after the line has spent at least 26 weeks outside that zone. A reading that slips out of a zone and returns a few weeks later does not produce a second marker or a second alert. Alerts fire on the same two events.
═══════════════════════════════════════
█ FORWARD-RETURN PANEL
For each marked entry, the script records the chart symbol's return from the open of the following week to the close 13 weeks and 26 weeks after the entry week. Entry at the following open avoids assuming a fill in the week the report was released.
The panel shows the episode count, median return and share of positive returns for upper-zone entries, lower-zone entries, and every week with a valid reading. The all-weeks rows are the baseline: compare each zone's figures against them, not against zero. A row with fewer than 5 episodes shows "few" in place of statistics.
The panel is in-sample and descriptive. It runs no significance test, episode counts are small with default settings, and the all-weeks baseline uses overlapping windows. Treat it as a check on the reading, not as evidence that the reading has predictive value.
═══════════════════════════════════════
█ DASHBOARD
The dashboard shows the zone state, the active CFTC code with report and options setting, the hedger group, hedger and Managed Money net as a percent of open interest, both percentiles, and data age. Data age is the number of weeks since open interest last changed. The cell turns orange at 2 weeks or more, which flags a delayed report.
═══════════════════════════════════════
█ SETTINGS
Hedger group: Producer/Merchant, or Producer/Merchant plus Swap Dealers.
Include options: futures and options combined, or futures only.
COT futures contract: optional. Pick the futures contract whose report to read, for example ICEUS:SB1! for sugar. Left blank, the script uses the chart's own futures contract on CME, CBOT, NYMEX, COMEX or ICE US. On common spot and CFD symbols, and on unleveraged single-commodity ETFs that hold the commodity or its futures, such as XAUUSD, GLD, USO and CANE, it reads the futures report for the same commodity. Any other chart shows a centered prompt until a contract is picked.
CFTC code override: optional. A six-character CFTC code, such as 088691 for gold, takes priority over the contract setting and the chart. Examples: 088691 gold, 084691 silver, 085692 copper, 067651 WTI crude.
Percentile lookback: 156 weeks by default.
Extreme band width: 20 by default, which places the upper zone at 80 and above and the lower zone at 20 and below.
Episode separation: 26 weeks by default.
Short and long horizon: 13 and 26 weeks by default.
Minimum episodes: 5 by default.
Show dashboard and Show forward-return panel: both off by default. Turn them on in the Display and Forward-return panel groups.
═══════════════════════════════════════
█ LIMITATIONS
Weekly charts only. On any other timeframe the script plots nothing, fires no alerts and shows a centered warning to switch to 1W. COT data is weekly, and every window in the script is counted in weekly bars.
Physical commodities only. The Disaggregated report does not cover financial futures such as equity index, interest rate or currency contracts. The script shows a message when no data returns for the selected code.
CFTC-reported exchanges only. Futures on other exchanges, such as Brent on ICE Futures Europe, show a prompt instead of data. Equity ETFs such as oil and gas producer funds, and leveraged or inverse commodity ETFs, are not mapped to any commodity report.
Report timing. Positions are as of Tuesday and published the following Friday afternoon. Holidays and government shutdowns have delayed releases by days to weeks. Historical data shows each report at its as-of date, not the date it became public, so past readings include information that was not available in real time during those delays.
Roll gaps. Forward returns on an unadjusted continuous contract include the price gaps at each contract roll. Enable back-adjustment for continuous futures in the chart settings before reading the panel, particularly on energy contracts.
Positioning moves with price. In many physical markets, hedger net moves opposite to price from week to week, because hedgers add shorts into rallies and reduce them into declines. A zone entry often follows a large price move that has already happened.
Relative reading. A percentile describes where the current reading sits within the lookback window. A market whose positioning has shifted structurally can stay in one zone for long stretches.
History. Disaggregated data begins in 2006, and the first readings appear only after the lookback fills, about three years later with default settings.
Mapped and overridden symbols. On a spot, CFD or ETF chart, the positioning shown is the futures market's, and the forward-return panel measures the chart symbol, including any ETF roll and fee drag. When the override points at a different contract than the chart, the panel still measures the chart symbol.
═══════════════════════════════════════
█ ORIGINALITY
TradingView's built-in Commitment of Traders indicators display report metrics directly, and many published COT Index scripts rescale Legacy commercial or speculator net positions with min-max scaling. This script differs in four ways. It isolates the physical hedger category with Disaggregated data instead of the Legacy Commercial category, which also contains swap dealers. It normalizes by open interest before ranking. It uses a percentile rank and de-clusters zone entries so each episode counts once. It measures the chart symbol's return after each entry against an all-weeks baseline on the same chart.
COT tickers are built with TradingView's LibraryCOT library.

Disclaimer
The information and publications are not meant to be, and do not constitute, financial, investment, trading, or other types of advice or recommendations supplied or endorsed by TradingView. Read more in the Terms of Use.
Disclaimer
The information and publications are not meant to be, and do not constitute, financial, investment, trading, or other types of advice or recommendations supplied or endorsed by TradingView. Read more in the Terms of Use.