Updated
Aurora_FLux_VWAP_V2 (Drizzle_ALGO56)
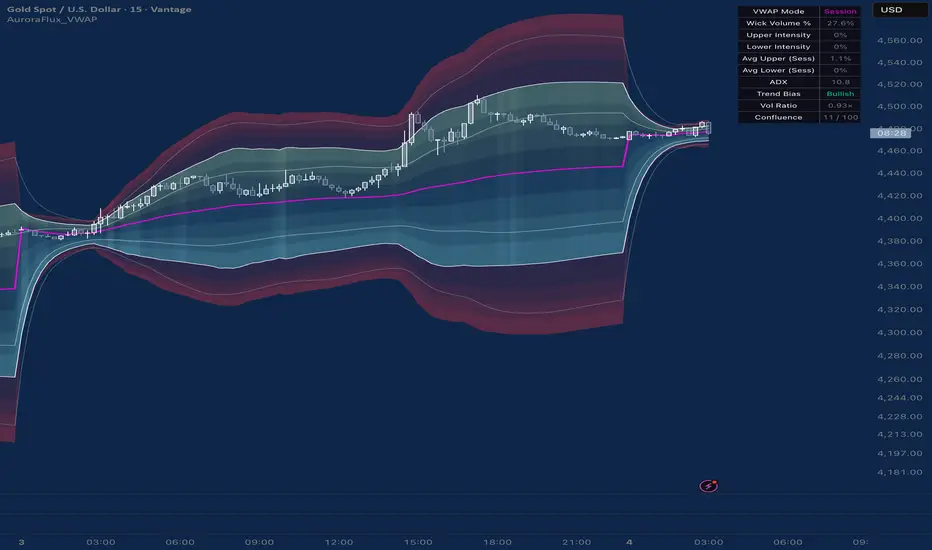
Aurora Flux is an adaptive VWAP system that combines volume-weighted price analysis, dynamic volatility envelopes, ADX trend filtering, and lower-timeframe wick volume analysis.
The indicator builds a volume-weighted VWAP core and expands its bands using both volume intensity and ADX strength. It then analyzes lower-timeframe data to measure how much volume occurred in the wicks versus the body of each candle. When strong wick volume coincides with price entering the outer zones, multi-layer intensity clouds light up to visualize buying or selling pressure.
The result is a clear visual map of rejection strength around the VWAP structure.
█ How It Works
⚪ Adaptive VWAP Core
Calculates either a Session VWAP or a Rolling VWAP together with volume-weighted variance. Band width is then modulated by two forces at the same time: current volume ratio and normalized ADX strength.
⚪ Wick Volume Analysis
Uses lower-timeframe data to split every chart candle into body volume and wick volume. A smoothed wick-volume ratio is calculated and used as the main intensity driver.
⚪ Intensity Mapping
When price enters the Extreme Zones (or the Main Channel depending on the selected mode), the current wick ratio is converted into an intensity value.
• Upper intensity reflects Sell pressure
• Lower intensity reflects Buy pressure
The intensity directly controls the opacity of the multi-layer clouds.
⚪ Session Average Tracking
A running average of Upper and Lower intensity is maintained throughout the session and displayed in the Dashboard. This shows the dominant rejection bias of the day.
█ How to Use
⚪ Identify Rejection Zones
Strong Extreme Zone clouds highlight price areas where high wick volume rejected the move.
These zones can act as high-quality support or resistance.
⚪ Read Buy vs Sell Pressure
• Rising Upper Intensity = increasing Sell pressure
• Rising Lower Intensity = increasing Buy pressure
Compare the current intensity with the Session Average to judge whether the rejection is stronger or weaker than the day’s average.
⚪ Combine with ADX
When ADX is high, the bands automatically widen. This reduces false signals during strong trends and keeps the focus on mean-reversion environments.
⚪ Classic Stdev Bands
Optional multi-level standard deviation bands can be enabled for additional fixed statistical reference levels.
█ Settings
• VWAP Mode (Rolling / Session)
• Base Deviation Multiplier & Volume Expansion Factor
• ADX Length, Smoothing and Band Multiplier
• Cloud Mode (Extreme Zone / Main VWAP / Both)
• Extreme Zone Offset & Width
• Main Channel and Extreme Zone colors (single color → automatic gradient)
• Automatic or Manual Lower Timeframe
• Wick Volume Ratio Threshold
• Dashboard HUD
█ Development Status
This indicator is still experimental and under active development.
Default settings are a starting point. Optimal results usually require manual fine-tuning of the Volume Expansion Factor, ADX Influence, Wick Threshold and Zone Width depending on the instrument and timeframe.
█ Feedback
Found a bug, have a suggestion, or want a specific improvement?
Feel free to reach out via TradingView private messages or leave a comment under the script. Feedback is highly appreciated.
█ Disclaimer
The content provided in this script is for educational and informational purposes only. It does not constitute financial advice, investment recommendations, or a solicitation to buy or sell any financial instruments. Past performance is not indicative of future results. All trading involves risk, and you are solely responsible for your own trading decisions.
The indicator builds a volume-weighted VWAP core and expands its bands using both volume intensity and ADX strength. It then analyzes lower-timeframe data to measure how much volume occurred in the wicks versus the body of each candle. When strong wick volume coincides with price entering the outer zones, multi-layer intensity clouds light up to visualize buying or selling pressure.
The result is a clear visual map of rejection strength around the VWAP structure.
█ How It Works
⚪ Adaptive VWAP Core
Calculates either a Session VWAP or a Rolling VWAP together with volume-weighted variance. Band width is then modulated by two forces at the same time: current volume ratio and normalized ADX strength.
⚪ Wick Volume Analysis
Uses lower-timeframe data to split every chart candle into body volume and wick volume. A smoothed wick-volume ratio is calculated and used as the main intensity driver.
⚪ Intensity Mapping
When price enters the Extreme Zones (or the Main Channel depending on the selected mode), the current wick ratio is converted into an intensity value.
• Upper intensity reflects Sell pressure
• Lower intensity reflects Buy pressure
The intensity directly controls the opacity of the multi-layer clouds.
⚪ Session Average Tracking
A running average of Upper and Lower intensity is maintained throughout the session and displayed in the Dashboard. This shows the dominant rejection bias of the day.
█ How to Use
⚪ Identify Rejection Zones
Strong Extreme Zone clouds highlight price areas where high wick volume rejected the move.
These zones can act as high-quality support or resistance.
⚪ Read Buy vs Sell Pressure
• Rising Upper Intensity = increasing Sell pressure
• Rising Lower Intensity = increasing Buy pressure
Compare the current intensity with the Session Average to judge whether the rejection is stronger or weaker than the day’s average.
⚪ Combine with ADX
When ADX is high, the bands automatically widen. This reduces false signals during strong trends and keeps the focus on mean-reversion environments.
⚪ Classic Stdev Bands
Optional multi-level standard deviation bands can be enabled for additional fixed statistical reference levels.
█ Settings
• VWAP Mode (Rolling / Session)
• Base Deviation Multiplier & Volume Expansion Factor
• ADX Length, Smoothing and Band Multiplier
• Cloud Mode (Extreme Zone / Main VWAP / Both)
• Extreme Zone Offset & Width
• Main Channel and Extreme Zone colors (single color → automatic gradient)
• Automatic or Manual Lower Timeframe
• Wick Volume Ratio Threshold
• Dashboard HUD
█ Development Status
This indicator is still experimental and under active development.
Default settings are a starting point. Optimal results usually require manual fine-tuning of the Volume Expansion Factor, ADX Influence, Wick Threshold and Zone Width depending on the instrument and timeframe.
█ Feedback
Found a bug, have a suggestion, or want a specific improvement?
Feel free to reach out via TradingView private messages or leave a comment under the script. Feedback is highly appreciated.
█ Disclaimer
The content provided in this script is for educational and informational purposes only. It does not constitute financial advice, investment recommendations, or a solicitation to buy or sell any financial instruments. Past performance is not indicative of future results. All trading involves risk, and you are solely responsible for your own trading decisions.
Release Notes
### What’s New in v2• Completely restructured and cleaned codebase for better performance and readability
• Added Clean Mode (clouds only) for minimal chart clutter
• Added Confluence Score (0–100) combining wick intensity, ADX strength and distance from VWAP
• Improved intensity calculation with optional ADX filtering
• Session-aware intensity averages
• Better input organization with clearer tooltips
• Removed experimental features for a cleaner experience
• Optimized lower-timeframe wick volume engine
### How to Use
1. Watch for rising intensity (especially > 60%) in the extreme zones while the Confluence Score is elevated.
2. High wick volume % combined with strong ADX and price far from VWAP often marks exhaustion.
3. Use Clean Mode when you want a pure visual of rejection pressure.
4. The classic standard-deviation bands are optional and turned off by default.
### Notes
- This indicator is a visual analysis tool. It does not generate buy/sell signals by itself.
- Lower-timeframe data is requested automatically (or can be set manually).
- Best used on liquid instruments with reliable volume.
- Always combine with your own risk management and higher-timeframe context.

Disclaimer
The information and publications are not meant to be, and do not constitute, financial, investment, trading, or other types of advice or recommendations supplied or endorsed by TradingView. Read more in the Terms of Use.
Disclaimer
The information and publications are not meant to be, and do not constitute, financial, investment, trading, or other types of advice or recommendations supplied or endorsed by TradingView. Read more in the Terms of Use.