OPEN-SOURCE SCRIPT
TraxisLab - Bitcoin Market Edge
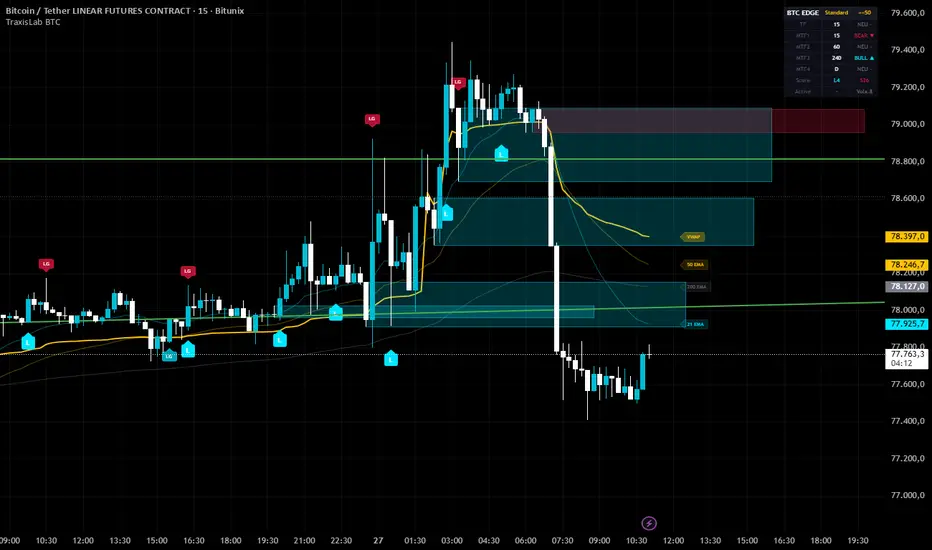
TraxisLab Bitcoin Market Edge is a Bitcoin-focused confluence indicator designed to combine trend, momentum, volume flow, VWAP, orderblocks, liquidity grabs, multi-timeframe bias, and structured risk levels into one clean trading overlay.
The script is built specifically as a decision-support framework for BTC traders who want a compact market edge model directly on the chart.
Core Concept
Bitcoin Market Edge uses a weighted scoring matrix to compare bullish and bearish conditions.
Instead of triggering entries from one isolated signal, the indicator evaluates several market components at the same time:
Volatility-adjusted EMA trend
Trend-adaptive RSI
OBV-based volume flow
Daily VWAP position and reclaim logic
Orderblock interaction
Liquidity grab detection
Break of structure
Multi-timeframe bias
Strong-volume confirmation
A long or short signal is only displayed when the score reaches the selected threshold, the opposite side is weaker by the required score gap, and cooldown rules are satisfied.
Signal Modes
The script includes three operating modes:
Aggressive
More responsive signals with a lower score threshold.
Standard
Balanced signal generation for general use.
Conservative
Stricter filtering with fewer but more selective signals.
A manual score override is available for users who want to define their own required score threshold.
Volatility-Adjusted EMAs
The indicator uses three EMAs:
Fast EMA
Mid EMA
Slow EMA
When volatility adjustment is enabled, EMA speed adapts to current ATR conditions.
In higher volatility, the EMAs can respond faster, while calmer conditions keep the trend model smoother.
The trend engine evaluates EMA alignment and EMA slope to classify the market as bullish, bearish, or neutral.
Trend-Adaptive RSI
The RSI logic adapts to the current trend environment.
In bullish conditions, RSI is interpreted differently than in bearish or neutral conditions.
This helps separate trend continuation momentum from potential exhaustion or reversal behavior.
The script can detect:
Bullish RSI continuation
Bearish RSI continuation
Extreme long conditions
Extreme short conditions
RSI slope shifts
Volume Flow, OBV & VWAP
Bitcoin Market Edge includes a volume-flow layer based on smoothed OBV and Daily VWAP.
This section helps identify whether volume is supporting the current price direction.
It evaluates:
OBV direction
OBV trend vs slower OBV average
Strong volume compared to volume moving average
Price position above or below Daily VWAP
VWAP reclaim events
VWAP proximity
This makes VWAP and volume flow an important part of the score model.
Orderblocks & Liquidity Grabs
The script detects basic bullish and bearish orderblocks after break-of-structure events.
It can display active orderblock zones directly on the chart and track when price trades back into them.
It also detects liquidity grabs:
Bullish liquidity grab below a previous pivot low
Bearish liquidity grab above a previous pivot high
These events are included in the confluence score and can also be displayed as compact “LG” markers.
Multi-Timeframe Bias Dashboard
The indicator checks up to four user-defined higher or lower timeframes.
Each timeframe is scored using:
EMA structure
Price position relative to the slow EMA
RSI bias
The dashboard displays the bias for each selected timeframe as bullish, bearish, or neutral.
This helps traders quickly see whether the current chart aligns with broader market direction.
Confluence Scoring Matrix
The scoring model compares long and short conditions across five categories:
Trend
RSI / momentum
Volume flow and VWAP
Orderblocks, BOS, and liquidity grabs
Multi-timeframe bias
Strong volume can add an additional score boost to the dominant side.
Signals require:
Score above the selected threshold
Minimum long/short score gap
Cooldown confirmation
Confirmed bar if enabled
No active same-direction signal conflict
This helps reduce weak or conflicting signals.
Risk Targets
When a signal appears, the script calculates visual trade levels:
Entry
Stop Loss
TP1
TP2
TP3
The stop is based on ATR, while take-profit levels are based on configurable risk-reward multiples.
These levels are drawn directly on the chart for the active setup.
Visual Features
The indicator includes a clean visual layout with:
Long and short signal labels
Tooltip details with score, entry, SL, TP levels, and MTF count
Volatility-adjusted EMAs
Daily VWAP
EMA and VWAP right-side labels
Bullish and bearish orderblock boxes
Liquidity grab markers
Active entry, stop, and target lines
Multi-timeframe dashboard
Most visuals can be enabled, disabled, or customized in the settings.
Alerts
The script includes alert conditions for:
Long entry
Short entry
Bullish BOS
Bearish BOS
Bullish liquidity grab
Bearish liquidity grab
Price entering bullish orderblock
Price entering bearish orderblock
These alerts can be used to monitor BTC setups without constantly watching the chart.
How to Use
Use Bitcoin Market Edge as a BTC-focused confluence and risk-mapping tool.
Typical use cases include:
Finding long or short opportunities when multiple BTC-specific conditions align
Confirming trend direction with volatility-adjusted EMAs
Checking volume support through OBV and VWAP
Watching for liquidity grabs around pivots
Tracking orderblock reactions after BOS events
Comparing current chart direction with multi-timeframe bias
Mapping risk and reward levels after a signal
For stronger setups, look for signals that align with higher-timeframe bias, strong volume, VWAP direction, and nearby orderblock or liquidity-grab context.
Notes
This script is optimized for Bitcoin market analysis but can also be applied to other liquid crypto markets.
The quality of signals may vary depending on the selected exchange, timeframe, volume data, and market conditions.
Orderblocks and liquidity grabs are simplified structural models and should be used as context rather than guaranteed reversal zones.
The indicator does not execute trades automatically.
Disclaimer
This indicator is for educational and analytical purposes only.
It does not provide financial advice, trading recommendations, or guaranteed results. Always use proper risk management and perform your own analysis before entering any trade.
The script is built specifically as a decision-support framework for BTC traders who want a compact market edge model directly on the chart.
Core Concept
Bitcoin Market Edge uses a weighted scoring matrix to compare bullish and bearish conditions.
Instead of triggering entries from one isolated signal, the indicator evaluates several market components at the same time:
Volatility-adjusted EMA trend
Trend-adaptive RSI
OBV-based volume flow
Daily VWAP position and reclaim logic
Orderblock interaction
Liquidity grab detection
Break of structure
Multi-timeframe bias
Strong-volume confirmation
A long or short signal is only displayed when the score reaches the selected threshold, the opposite side is weaker by the required score gap, and cooldown rules are satisfied.
Signal Modes
The script includes three operating modes:
Aggressive
More responsive signals with a lower score threshold.
Standard
Balanced signal generation for general use.
Conservative
Stricter filtering with fewer but more selective signals.
A manual score override is available for users who want to define their own required score threshold.
Volatility-Adjusted EMAs
The indicator uses three EMAs:
Fast EMA
Mid EMA
Slow EMA
When volatility adjustment is enabled, EMA speed adapts to current ATR conditions.
In higher volatility, the EMAs can respond faster, while calmer conditions keep the trend model smoother.
The trend engine evaluates EMA alignment and EMA slope to classify the market as bullish, bearish, or neutral.
Trend-Adaptive RSI
The RSI logic adapts to the current trend environment.
In bullish conditions, RSI is interpreted differently than in bearish or neutral conditions.
This helps separate trend continuation momentum from potential exhaustion or reversal behavior.
The script can detect:
Bullish RSI continuation
Bearish RSI continuation
Extreme long conditions
Extreme short conditions
RSI slope shifts
Volume Flow, OBV & VWAP
Bitcoin Market Edge includes a volume-flow layer based on smoothed OBV and Daily VWAP.
This section helps identify whether volume is supporting the current price direction.
It evaluates:
OBV direction
OBV trend vs slower OBV average
Strong volume compared to volume moving average
Price position above or below Daily VWAP
VWAP reclaim events
VWAP proximity
This makes VWAP and volume flow an important part of the score model.
Orderblocks & Liquidity Grabs
The script detects basic bullish and bearish orderblocks after break-of-structure events.
It can display active orderblock zones directly on the chart and track when price trades back into them.
It also detects liquidity grabs:
Bullish liquidity grab below a previous pivot low
Bearish liquidity grab above a previous pivot high
These events are included in the confluence score and can also be displayed as compact “LG” markers.
Multi-Timeframe Bias Dashboard
The indicator checks up to four user-defined higher or lower timeframes.
Each timeframe is scored using:
EMA structure
Price position relative to the slow EMA
RSI bias
The dashboard displays the bias for each selected timeframe as bullish, bearish, or neutral.
This helps traders quickly see whether the current chart aligns with broader market direction.
Confluence Scoring Matrix
The scoring model compares long and short conditions across five categories:
Trend
RSI / momentum
Volume flow and VWAP
Orderblocks, BOS, and liquidity grabs
Multi-timeframe bias
Strong volume can add an additional score boost to the dominant side.
Signals require:
Score above the selected threshold
Minimum long/short score gap
Cooldown confirmation
Confirmed bar if enabled
No active same-direction signal conflict
This helps reduce weak or conflicting signals.
Risk Targets
When a signal appears, the script calculates visual trade levels:
Entry
Stop Loss
TP1
TP2
TP3
The stop is based on ATR, while take-profit levels are based on configurable risk-reward multiples.
These levels are drawn directly on the chart for the active setup.
Visual Features
The indicator includes a clean visual layout with:
Long and short signal labels
Tooltip details with score, entry, SL, TP levels, and MTF count
Volatility-adjusted EMAs
Daily VWAP
EMA and VWAP right-side labels
Bullish and bearish orderblock boxes
Liquidity grab markers
Active entry, stop, and target lines
Multi-timeframe dashboard
Most visuals can be enabled, disabled, or customized in the settings.
Alerts
The script includes alert conditions for:
Long entry
Short entry
Bullish BOS
Bearish BOS
Bullish liquidity grab
Bearish liquidity grab
Price entering bullish orderblock
Price entering bearish orderblock
These alerts can be used to monitor BTC setups without constantly watching the chart.
How to Use
Use Bitcoin Market Edge as a BTC-focused confluence and risk-mapping tool.
Typical use cases include:
Finding long or short opportunities when multiple BTC-specific conditions align
Confirming trend direction with volatility-adjusted EMAs
Checking volume support through OBV and VWAP
Watching for liquidity grabs around pivots
Tracking orderblock reactions after BOS events
Comparing current chart direction with multi-timeframe bias
Mapping risk and reward levels after a signal
For stronger setups, look for signals that align with higher-timeframe bias, strong volume, VWAP direction, and nearby orderblock or liquidity-grab context.
Notes
This script is optimized for Bitcoin market analysis but can also be applied to other liquid crypto markets.
The quality of signals may vary depending on the selected exchange, timeframe, volume data, and market conditions.
Orderblocks and liquidity grabs are simplified structural models and should be used as context rather than guaranteed reversal zones.
The indicator does not execute trades automatically.
Disclaimer
This indicator is for educational and analytical purposes only.
It does not provide financial advice, trading recommendations, or guaranteed results. Always use proper risk management and perform your own analysis before entering any trade.
Open-source script
In true TradingView spirit, the creator of this script has made it open-source, so that traders can review and verify its functionality. Kudos to the author! While you can use it for free, remember that republishing the code is subject to our House Rules.

Disclaimer
The information and publications are not meant to be, and do not constitute, financial, investment, trading, or other types of advice or recommendations supplied or endorsed by TradingView. Read more in the Terms of Use.
Open-source script
In true TradingView spirit, the creator of this script has made it open-source, so that traders can review and verify its functionality. Kudos to the author! While you can use it for free, remember that republishing the code is subject to our House Rules.
Disclaimer
The information and publications are not meant to be, and do not constitute, financial, investment, trading, or other types of advice or recommendations supplied or endorsed by TradingView. Read more in the Terms of Use.