OPEN-SOURCE SCRIPT
Adaptive Daytrade Signal
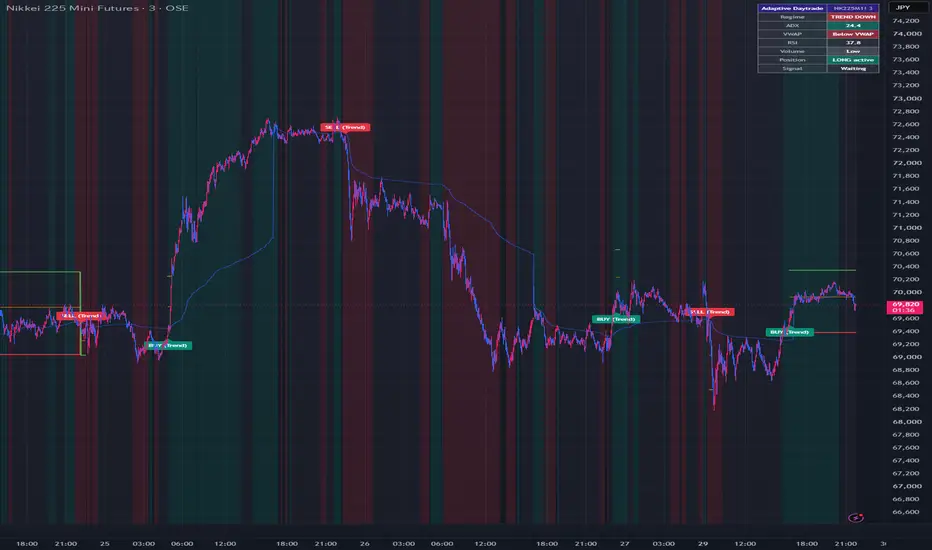
This is an adaptive day trading signal that analyzes market conditions using ADX+EMA; in trending markets, it automatically switches to VWAP+EMA to follow the trend on pullbacks, and in ranging markets, it switches to RSI + Bollinger Bands for counter-trend trading.
Recommended timeframes: 3- to 15-minute charts; Instruments: Nikkei 225 futures, S&P 500; for individual stocks, high-volume large-cap stocks; Session restrictions: For individual stocks, it’s effective to wait and see for the first 30 minutes after the open (adjust using “Limit to session”)
The key feature is that it automatically assesses market conditions and switches trading strategies accordingly. The chart background color lets you see the current market phase at a glance (green = uptrend, red = downtrend, gray = range-bound).
In trending phases (trend-following), the system waits for pullbacks or retracements to the EMA9 and enters only when the price is moving in the same direction as the VWAP. This is a classic approach in stock day trading and offers a good balance between win rate and potential profit.
In ranging phases (counter-trend), the system targets rebounds at the outer bands of the Bollinger Bands combined with RSI overbought conditions. Since attempting to follow the trend when there is no clear trend can result in being caught in a round-trip loss, the system automatically switches to this strategy when the ADX is weak.
In line with our opportunity-focused risk management policy, we set stop-losses relatively tight (based on the most recent swing or ATR × 1.0) and use a two-tiered profit-taking strategy: TP1 (1R) as a target for partial profit-taking, and TP2 (2.5R) to let profits run. Stop-loss and profit-taking lines are automatically displayed on the chart.
Since all parameters are adjustable, by adjusting the two settings—ADX trend threshold (trend detection sensitivity) and Volume vs. avg (volume filter)—you can balance the frequency of signals between prioritizing opportunities and prioritizing accuracy.
This indicator is calculated based on closing price candlesticks and does not use `request.security`, so there is no risk of repainting. However, signals are confirmed once the candlestick closes, and labels are displayed after the candlestick closes.
Recommended timeframes: 3- to 15-minute charts; Instruments: Nikkei 225 futures, S&P 500; for individual stocks, high-volume large-cap stocks; Session restrictions: For individual stocks, it’s effective to wait and see for the first 30 minutes after the open (adjust using “Limit to session”)
The key feature is that it automatically assesses market conditions and switches trading strategies accordingly. The chart background color lets you see the current market phase at a glance (green = uptrend, red = downtrend, gray = range-bound).
In trending phases (trend-following), the system waits for pullbacks or retracements to the EMA9 and enters only when the price is moving in the same direction as the VWAP. This is a classic approach in stock day trading and offers a good balance between win rate and potential profit.
In ranging phases (counter-trend), the system targets rebounds at the outer bands of the Bollinger Bands combined with RSI overbought conditions. Since attempting to follow the trend when there is no clear trend can result in being caught in a round-trip loss, the system automatically switches to this strategy when the ADX is weak.
In line with our opportunity-focused risk management policy, we set stop-losses relatively tight (based on the most recent swing or ATR × 1.0) and use a two-tiered profit-taking strategy: TP1 (1R) as a target for partial profit-taking, and TP2 (2.5R) to let profits run. Stop-loss and profit-taking lines are automatically displayed on the chart.
Since all parameters are adjustable, by adjusting the two settings—ADX trend threshold (trend detection sensitivity) and Volume vs. avg (volume filter)—you can balance the frequency of signals between prioritizing opportunities and prioritizing accuracy.
This indicator is calculated based on closing price candlesticks and does not use `request.security`, so there is no risk of repainting. However, signals are confirmed once the candlestick closes, and labels are displayed after the candlestick closes.
Open-source script
In true TradingView spirit, the creator of this script has made it open-source, so that traders can review and verify its functionality. Kudos to the author! While you can use it for free, remember that republishing the code is subject to our House Rules.

Disclaimer
The information and publications are not meant to be, and do not constitute, financial, investment, trading, or other types of advice or recommendations supplied or endorsed by TradingView. Read more in the Terms of Use.
Open-source script
In true TradingView spirit, the creator of this script has made it open-source, so that traders can review and verify its functionality. Kudos to the author! While you can use it for free, remember that republishing the code is subject to our House Rules.
Disclaimer
The information and publications are not meant to be, and do not constitute, financial, investment, trading, or other types of advice or recommendations supplied or endorsed by TradingView. Read more in the Terms of Use.