Support & Resistance Ultra Toolkit [AlgoAlpha]
More exclusive indicators from AlgoAlpha
Subscribe to Unfair Advantage Pack for $65.57/month to get exclusive indicators by this author. You pay right on TradingView and can use them on your charts straight away.
Explore Unfair Advantage Pack🟠 OVERVIEW
Support and resistance levels often represent areas where price has reacted before. But identifying which levels remain relevant, how price interacts with them, and when they are no longer valid can be difficult when relying on manually drawn lines.
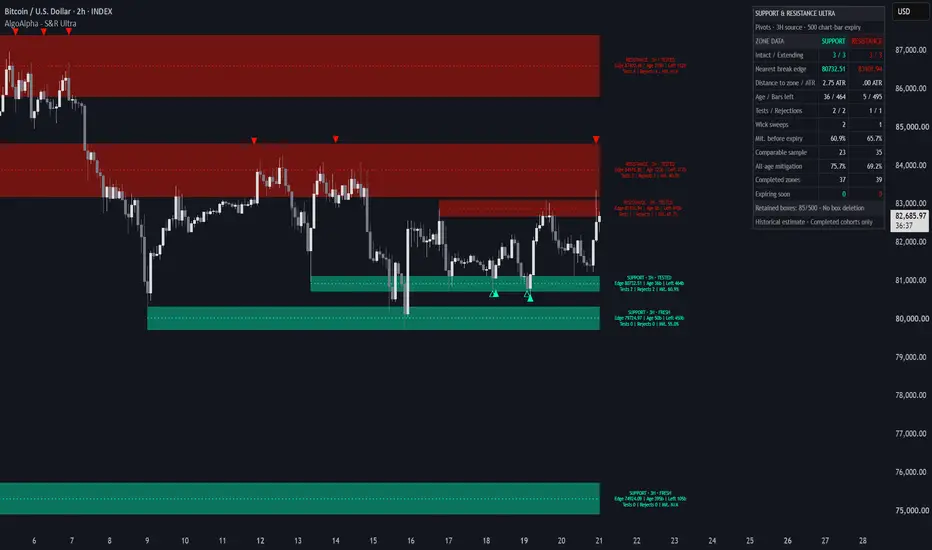
Support & Resistance Ultra Toolkit [AlgoAlpha] identifies price zones using two detection methods: Pivot-Based and Donchian-Based. Pivot detection finds areas where multiple swing highs or lows form near the same price. Donchian detection identifies channel boundaries that remain unchanged over a specified period. Both methods convert these levels into support and resistance zones with defined price boundaries.
The indicator also tracks price interactions, including rejections, wick sweeps, and confirmed breakouts. Each zone includes historical interaction statistics, while a dashboard provides information about nearby levels, zone age, and estimated mitigation rates based on completed historical zones.
🟠 CONCEPTS
🟠 FEATURES
🟠 HOW TO USE
🟠 CONCLUSION
Support & Resistance Ultra Toolkit [AlgoAlpha] combines pivot-based and Donchian-based zone detection with price reaction signals, historical zone tracking, and mitigation statistics. It gives traders a structured way to identify support and resistance, evaluate how price behaves around these areas, and distinguish rejections from confirmed breaks.
Support and resistance levels often represent areas where price has reacted before. But identifying which levels remain relevant, how price interacts with them, and when they are no longer valid can be difficult when relying on manually drawn lines.
Support & Resistance Ultra Toolkit [AlgoAlpha] identifies price zones using two detection methods: Pivot-Based and Donchian-Based. Pivot detection finds areas where multiple swing highs or lows form near the same price. Donchian detection identifies channel boundaries that remain unchanged over a specified period. Both methods convert these levels into support and resistance zones with defined price boundaries.
The indicator also tracks price interactions, including rejections, wick sweeps, and confirmed breakouts. Each zone includes historical interaction statistics, while a dashboard provides information about nearby levels, zone age, and estimated mitigation rates based on completed historical zones.
🟠 CONCEPTS
- Support and Resistance Zones — Price ranges where buying or selling pressure may affect future price movement. Support zones form around repeated lows or stable lower channel boundaries, while resistance zones form around repeated highs or stable upper channel boundaries.
- Pivot-Based Detection — Identifies confirmed swing highs and lows using a configurable number of bars on either side. Two pivots of the same type must occur within the maximum bar gap and a price tolerance based on the standard deviation of closing prices. Matching pivots establish the boundaries of a zone.
- Donchian-Based Detection — Uses the highest high and lowest low over a selected lookback period. When either channel boundary remains unchanged for the required number of bars, the indicator creates a zone around that level. Zone thickness adjusts to price volatility.
- Zone Rejection — Occurs when price interacts with a zone and subsequently closes beyond its inner boundary in the expected direction. A support rejection requires a close above the support zone, while a resistance rejection requires a close below the resistance zone.
- Wick Sweep — Occurs when a candle wick crosses the outer boundary of a zone but the candle body remains on the original side of that boundary. This represents a temporary move beyond support or resistance without a confirmed close-through.
- Zone Mitigation — A confirmed candle close beyond the outer boundary of a zone. Support is considered broken when price closes below its lower boundary, while resistance is considered broken when price closes above its upper boundary.
- Historical Mitigation Estimate — The percentage of comparable completed zones that eventually experienced a close-through before expiry, conditional on surviving to the specified age. Support and resistance are evaluated separately. The estimate requires at least 20 historical samples and is not a guaranteed prediction.
- Zone Expiry — The maximum number of chart bars a zone can continue extending. A zone stops extending when it reaches its expiry limit or, if enabled, when price closes through its outer boundary. Historical zones remain visible after extension stops.
🟠 FEATURES
- Dual Support and Resistance Detection — Switch between Pivot and Donchian methods to identify price zones based on repeated swing points or stable channel boundaries.
- Price Reaction Signals — Displays bullish and bearish triangles when price rejects or breaks a zone, with hollow triangles identifying wick sweeps. Signals are confirmed using the chart timeframe, including when zones originate from a higher timeframe.
- Zone Information Labels — Displays each active zone's timeframe, status, price boundary, age, remaining lifespan, tests, rejections, and historical mitigation estimate. Additional information is available through label tooltips.
- Support and Resistance Dashboard — Summarizes active zones and their historical behavior, including nearby break boundaries, ATR-normalized distance, tests, rejections, wick sweeps, mitigation estimates, sample counts, and zones approaching expiry.
🟠 HOW TO USE
- Select a Detection Mode — Use Pivots to identify zones formed by repeated swing highs and lows. Use Donchian to identify price boundaries that have remained stable over several bars.
- Adjust Zone Sensitivity — In Pivot mode, increase Pivot Length to focus on larger swings, or adjust Match Tolerance to control how closely two pivots must align. In Donchian mode, adjust Channel Length and Flat Bars to control which stable boundaries qualify as zones.
- Identify Nearby Support and Resistance — Look for green zones below price as potential support and red zones above price as potential resistance. Use the dashboard to compare nearby levels and their distance from current price.
- Watch for Rejection Signals — When price enters a support zone and closes back above it, a bullish rejection may indicate that buyers are defending the area. Apply the opposite logic to bearish rejections at resistance.
- Identify Wick Sweeps — Watch for hollow triangles when price briefly moves beyond a zone boundary but fails to close through it. These events can help identify failed attempts to move beyond established levels.
- Confirm Breakouts — Look for a candle close beyond the outer boundary of a zone. A close above resistance produces a bullish breakout signal, while a close below support produces a bearish breakout signal. Consider waiting for a retest before making a trading decision.
- Evaluate Zone History — Use the zone labels and dashboard to review previous tests, rejections, and mitigation estimates. Higher historical mitigation percentages indicate that comparable zones broke more frequently in the observed sample, not that the current zone is certain to break.
- Use Higher Timeframe Zones — Enable Higher Timeframe detection to display support and resistance formed on a larger timeframe. Price interactions and signals still follow confirmed candles on the current chart timeframe.
- Manage Zone Lifespan — Adjust Zone Expiry to control how long zones extend. Enable Stop on Break to end extension after a confirmed close-through, or disable it to retain the zone until its expiry limit.
- Configure Alerts — Create TradingView alerts for new zones, touches, rejections, wick sweeps, close-through breakouts, expiry events, or high mitigation estimates. Use these alerts to monitor relevant price interactions without continuously watching the chart.
🟠 CONCLUSION
Support & Resistance Ultra Toolkit [AlgoAlpha] combines pivot-based and Donchian-based zone detection with price reaction signals, historical zone tracking, and mitigation statistics. It gives traders a structured way to identify support and resistance, evaluate how price behaves around these areas, and distinguish rejections from confirmed breaks.

🚨Get premium: algoalpha.io
🛜Get FREE signals: discord.gg/xCmqTVRexz
💡Tutorials: youtube.com/@AlgoAlpha
🛜Get FREE signals: discord.gg/xCmqTVRexz
💡Tutorials: youtube.com/@AlgoAlpha
Disclaimer
The information and publications are not meant to be, and do not constitute, financial, investment, trading, or other types of advice or recommendations supplied or endorsed by TradingView. Read more in the Terms of Use.
🚨Get premium: algoalpha.io
🛜Get FREE signals: discord.gg/xCmqTVRexz
💡Tutorials: youtube.com/@AlgoAlpha
🛜Get FREE signals: discord.gg/xCmqTVRexz
💡Tutorials: youtube.com/@AlgoAlpha
Disclaimer
The information and publications are not meant to be, and do not constitute, financial, investment, trading, or other types of advice or recommendations supplied or endorsed by TradingView. Read more in the Terms of Use.