OPEN-SOURCE SCRIPT
Updated RSI Candlestick Chart
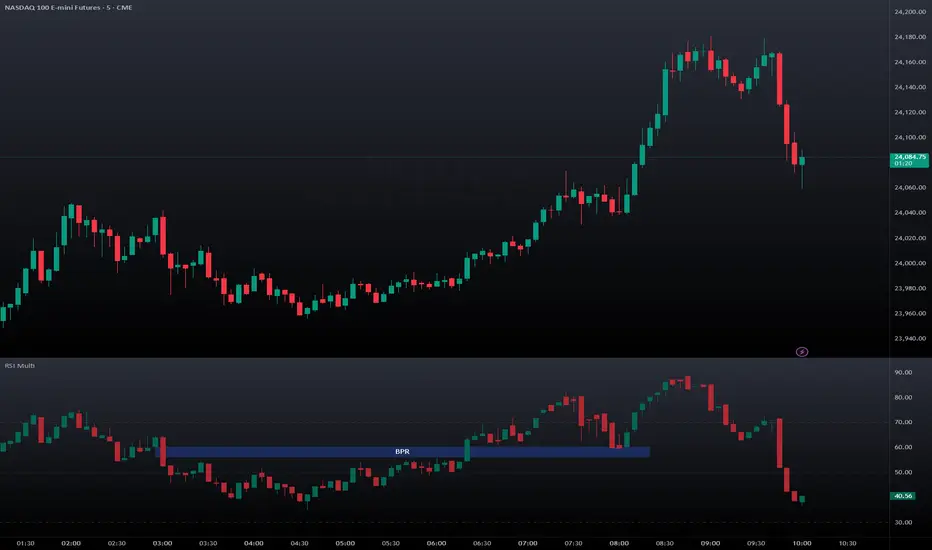
A simple and clean yet powerful RSI in candlestick version.
The concept is simple: just like a line chart hides from you a lot of information that candlestick chart can reveal, why not doing the same with RSI?
Now you can clearly see the wicks, patterns, structure at a single glance.
FVG, BPR, hammer, you name it.
The concept is simple: just like a line chart hides from you a lot of information that candlestick chart can reveal, why not doing the same with RSI?
Now you can clearly see the wicks, patterns, structure at a single glance.
FVG, BPR, hammer, you name it.
Release Notes
The new updated version adds the possibility to switch to Heiken Ashi or back to line chart if needed. Also updated it to V6 while at it. Release Notes
small update to restore the proper chart styleOpen-source script
In true TradingView spirit, the creator of this script has made it open-source, so that traders can review and verify its functionality. Kudos to the author! While you can use it for free, remember that republishing the code is subject to our House Rules.

Disclaimer
The information and publications are not meant to be, and do not constitute, financial, investment, trading, or other types of advice or recommendations supplied or endorsed by TradingView. Read more in the Terms of Use.
Open-source script
In true TradingView spirit, the creator of this script has made it open-source, so that traders can review and verify its functionality. Kudos to the author! While you can use it for free, remember that republishing the code is subject to our House Rules.
Disclaimer
The information and publications are not meant to be, and do not constitute, financial, investment, trading, or other types of advice or recommendations supplied or endorsed by TradingView. Read more in the Terms of Use.