CA Flight Check - Reclaim Map
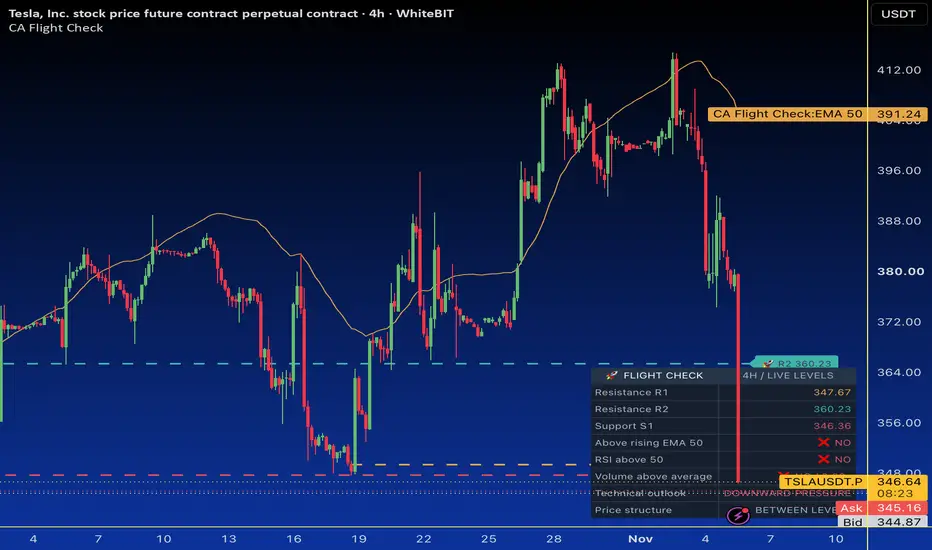
Tesla showed us a new flying Roadster - and it made me want to build a tool that checks what an asset needs to overcome before it can potentially take off.
CA Flight Check is a technical indicator designed to help traders identify relevant price levels and assess the conditions surrounding potential price recoveries. Instead of displaying support and resistance alone, it combines an automatically generated price-level map with 3 technical checks: trend, momentum, and trading activity.
The goal is to make chart analysis easier to follow, particularly when an asset experiences a sharp price movement.
What it shows:
Levels are calculated from confirmed local highs and lows, with historical extremes used when suitable pivots are unavailable. ATR helps determine the spacing between resistance levels.
How to use it:
Why Flight Check?
Rather than displaying isolated indicators, Flight Check connects price structure with technical confirmation in one visual map, making initial chart analysis faster and easier to follow.
Limitations
Levels are historical references, not guaranteed turning points. Pivot confirmation requires subsequent candles, and volume availability varies by instrument. Technical checks use closed candles, while price levels react to the current market price.
Flight Check does not predict prices, incorporate news, or generate buy/sell signals.
CA Flight Check is a technical indicator designed to help traders identify relevant price levels and assess the conditions surrounding potential price recoveries. Instead of displaying support and resistance alone, it combines an automatically generated price-level map with 3 technical checks: trend, momentum, and trading activity.
The goal is to make chart analysis easier to follow, particularly when an asset experiences a sharp price movement.
What it shows:
- 🟠 R1: Nearest resistance above the current price.
- 🚀 R2: Next higher resistance.
- 🛡️ S1: Nearest support below the current price.
- EMA 50: Identifies the prevailing price trend.
- RSI 14: Evaluates momentum relative to the neutral level of 50.
- Volume MA 20: Compares trading activity with its 20-period average.
Levels are calculated from confirmed local highs and lows, with historical extremes used when suitable pivots are unavailable. ATR helps determine the spacing between resistance levels.
How to use it:
- Add Flight Check to any supported chart. All levels and calculations are automatic.
- The dashboard uses ✅ and ❌ to show which technical conditions are met. It also summarizes the market as upward alignment, downward pressure, or mixed conditions.
- This helps traders identify potential price obstacles and understand what technical conditions support or challenge a recovery scenario.
Why Flight Check?
Rather than displaying isolated indicators, Flight Check connects price structure with technical confirmation in one visual map, making initial chart analysis faster and easier to follow.
Limitations
Levels are historical references, not guaranteed turning points. Pivot confirmation requires subsequent candles, and volume availability varies by instrument. Technical checks use closed candles, while price levels react to the current market price.
Flight Check does not predict prices, incorporate news, or generate buy/sell signals.

Disclaimer
The information and publications are not meant to be, and do not constitute, financial, investment, trading, or other types of advice or recommendations supplied or endorsed by TradingView. Read more in the Terms of Use.
Disclaimer
The information and publications are not meant to be, and do not constitute, financial, investment, trading, or other types of advice or recommendations supplied or endorsed by TradingView. Read more in the Terms of Use.