OPEN-SOURCE SCRIPT
GME Quarterly OPEX Analysis
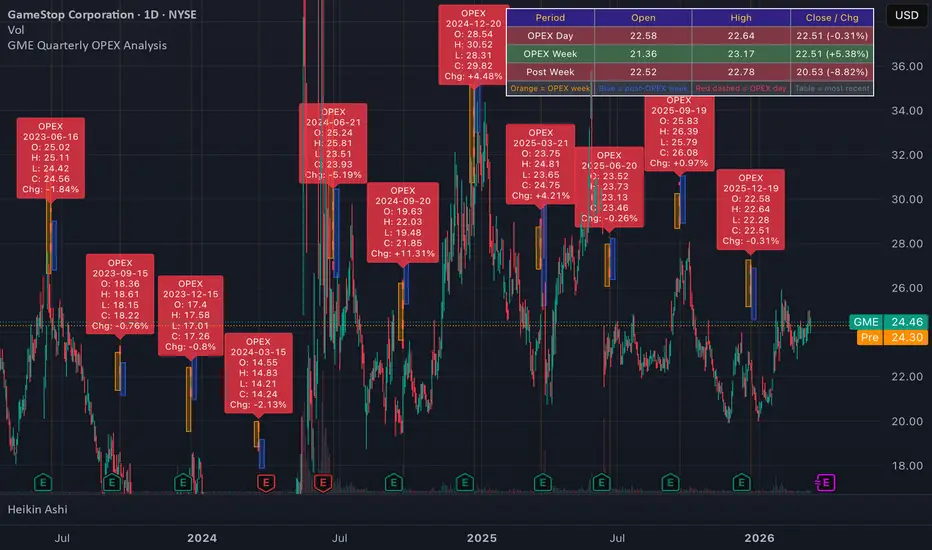
**GME Quarterly OPEX Analyzer** — marks every quarterly expiration date (3rd Friday of March, June, September, December) on a GME daily chart going back as far as chart data allows. For each OPEX it draws a red dashed vertical line, labels the day's OHLC and % change, shades the full OPEX week in orange, and shades the following week in blue. A table in the top-right shows the most recent OPEX day, OPEX week, and post-OPEX week OHLC with color-coded green/red results. Useful for visually identifying whether quarterly OPEX dates correlate with local price bottoms, tops, or reversals over time.
Open-source script
In true TradingView spirit, the creator of this script has made it open-source, so that traders can review and verify its functionality. Kudos to the author! While you can use it for free, remember that republishing the code is subject to our House Rules.

Disclaimer
The information and publications are not meant to be, and do not constitute, financial, investment, trading, or other types of advice or recommendations supplied or endorsed by TradingView. Read more in the Terms of Use.
Open-source script
In true TradingView spirit, the creator of this script has made it open-source, so that traders can review and verify its functionality. Kudos to the author! While you can use it for free, remember that republishing the code is subject to our House Rules.
Disclaimer
The information and publications are not meant to be, and do not constitute, financial, investment, trading, or other types of advice or recommendations supplied or endorsed by TradingView. Read more in the Terms of Use.