OPEN-SOURCE SCRIPT
Updated Confluence Matrix Multi-Timeframe Regime
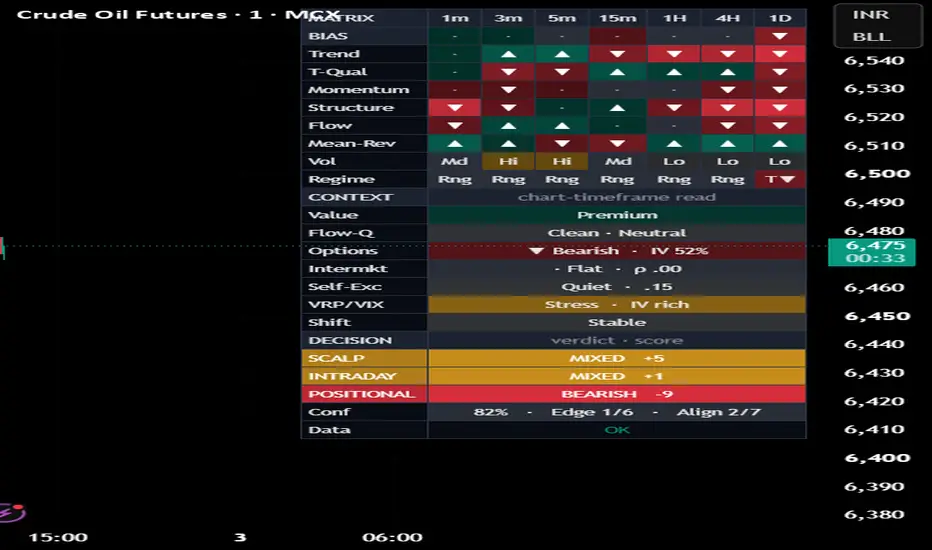
CONFLUENCE MATRIX — Multi-Timeframe Regime & Accuracy-Weighted Bias
================================================================================
WHAT THIS SCRIPT IS
A multi-timeframe decision panel. Across a fixed ladder of nine timeframes
(1m, 3m, 5m, 15m, 30m, 60m, 120m, 240m, Daily) it measures the same five
technical factors — trend, momentum, structure, volume flow and mean-reversion —
normalises each to a comparable scale, and fuses them into one directional bias
per timeframe. It then compares the timeframes to each other: how strongly they
agree (a confluence meter), how many of the nine are aligned, and whether the
fast timeframes are turning against the slow ones (a transition). It flags moves
that are exhausted, shows where volatility is compressing, and reports past-only
how often the overall bias has actually been followed through on the current
symbol, with a confidence interval.
WHY THE COMPONENTS ARE COMBINED (how the parts work together)
These are not separate indicators stacked in one pane. They are five reads of
the same question — "what is price doing and should I trust it?" — chosen
because they fail in different conditions, so combining them removes each
other's blind spots, and reading them across a full timeframe ladder removes the
blind spot of any single chart:
- TREND: an ATR SuperTrend blended with a moving-average stack. The SuperTrend
flips with less lag than a moving average alone; the stack confirms direction.
- MOMENTUM: MACD histogram + RSI + Stochastic. A three-oscillator read is harder
to whipsaw than any one of them.
- STRUCTURE: location of price within the recent range — acceptance in the
middle versus pressure at the edges.
- VOLUME FLOW: money-flow combined with position relative to the anchored VWAP,
i.e. whether price is above or below the session's volume-weighted fair value.
- MEAN-REVERSION: deviation from an adaptive equilibrium whose responsiveness
scales with the efficiency ratio. This is the counterweight that fades
extension — correct in a range, wrong in a trend.
Because a factor that helps in one regime hurts in another, the fusion is
governed by two layers that decide how much to trust each factor:
1. REGIME WEIGHTING. Each timeframe classifies its own regime from the
efficiency ratio, ADX and relative volatility, and reweights the factors
accordingly — trend and momentum lead in a trend, mean-reversion leads in a
range, and confidence is damped when volatility is elevated. A daily that is
trending and a 5-minute that is ranging are therefore scored by different
logic, which is the whole point of a multi-timeframe read.
2. PROVEN-ACCURACY WEIGHTING. The script tracks, on past bars only, how often
each individual factor's signal has been followed through on THIS symbol, and
scales that factor's weight by its measured hit-rate. So the fusion becomes
regime x proven-accuracy: on a symbol where, historically, mean-reversion has
paid and trend has not, the panel learns that and weights accordingly. This
is what turns a generic vote into a calibrated, symbol-aware read.
Two further layers handle the traps and the timing:
- EXHAUSTION. A fully-aligned stack that is also over-extended is the classic
"everything agrees right at the turn" trap. Exhausted timeframes are marked,
and the confluence meter is damped so that alignment-with-exhaustion is not
mistaken for high conviction.
- SQUEEZE. A read of where Bollinger bands sit inside Keltner channels —
volatility compression that tends to precede expansion. This adds timing
(when a move may start) to the directional read (which way).
The cross-timeframe layer then turns the nine composites into one verdict:
overall direction, a confluence meter, an alignment count, and a fast-versus-slow
transition flag. Calibration of the overall bias keeps the headline honest by
measuring its real follow-through on the current symbol.
HOW IT WORKS (mechanics, briefly)
Each timeframe's factors are computed with standard confirmation and requested
non-repainting; history does not change after the fact. The per-symbol accuracy
weights and the headline follow-through are built by recording a signal's
direction when it forms and checking, a fixed number of bars later, whether
price travelled a chosen ATR multiple in that direction, then aggregating into a
rate with a Wilson confidence interval. All thresholds are ATR-relative, so
nothing is tied to a particular price scale.
HOW TO USE
1. Read the headline bar (overall bias) and the CONFLUENCE meter, then scan the
Bias column down the ladder for a long aligned run.
2. A "!" on a Bias cell means that timeframe is exhausted; high alignment with
exhaustion is lower conviction, and the meter already reflects that.
3. Watch STATE (FULL STACK / TRANSITION) and the SQUEEZE row for timing.
4. Weight the read by FOLLOW-THROUGH — the overall bias's measured hit-rate here.
5. Everything is descriptive context, not a signal to act on.
USE ON ANY MARKET
The Price source input drives the trend, momentum, mean-reversion and structure
reads, so you can run the panel on standard candles, Heikin-Ashi, or another
price series across stocks, indices, futures, forex and crypto. High, low and
volume stay native for the range and flow factors, and a volume-borrow input
supplies volume for symbols that report none.
WHAT MAKES IT ORIGINAL
The contribution is the fusion, not the individual factors, which are standard.
Here the same regime-adaptive, volatility-normalised composite is computed
identically across a timeframe ladder, then weighted further by each factor's
past-only, per-symbol accuracy, with exhaustion damping and explicit alignment,
transition and squeeze context. A multi-timeframe panel that learns which
factors to trust on each symbol, and that damps alignment when a move is
exhausted, is the part that is not available elsewhere.
SETTINGS WORTH KNOWING
- Timeframe Ladder: the nine timeframes are editable.
- Fusion: toggle proven-accuracy weighting, exhaustion damping and the squeeze
read; the higher-timeframe emphasis slider controls how much slow timeframes
count in the overall (0 = equal weighting).
- Calibration: horizon and minimum follow-through define what counts as a
"followed-through" signal for both the accuracy weights and the headline rate.
- External signals (optional): three source inputs accept directional exports
from other indicators and blend them into the overall composite at the chart
timeframe; price sources are auto-ignored.
- Visuals: theme is auto/dark/light; size is Tiny/Small/Normal; the identity
strip shows the script name, symbol and timeframe.
NOTE ON TIMEFRAMES BELOW THE CHART
A timeframe lower than the chart returns its most recent value rather than a full
aggregated history. For a fully historical view of the fast rows, load the
indicator on a low chart timeframe; for a live current-state read, every row is
valid at any chart timeframe.
LIMITATIONS
Higher-timeframe values reflect the developing bar in real time; history is
non-repainting. Volume flow and anchored VWAP need real (or borrowed) volume. The
accuracy weighting and follow-through describe PAST behaviour only — they are not
a backtest and not a probability of future results. Every read is probabilistic
context, never a certainty.
DISCLAIMER
This is a study / indicator for chart analysis and education only. It is not a
strategy, not a recommendation, and not financial advice. It places no orders and
guarantees no outcome. Markets carry risk, and the past behaviour of a signal
does not assure its future behaviour. Do your own research and manage your own
risk.
================================================================================
WHAT THIS SCRIPT IS
A multi-timeframe decision panel. Across a fixed ladder of nine timeframes
(1m, 3m, 5m, 15m, 30m, 60m, 120m, 240m, Daily) it measures the same five
technical factors — trend, momentum, structure, volume flow and mean-reversion —
normalises each to a comparable scale, and fuses them into one directional bias
per timeframe. It then compares the timeframes to each other: how strongly they
agree (a confluence meter), how many of the nine are aligned, and whether the
fast timeframes are turning against the slow ones (a transition). It flags moves
that are exhausted, shows where volatility is compressing, and reports past-only
how often the overall bias has actually been followed through on the current
symbol, with a confidence interval.
WHY THE COMPONENTS ARE COMBINED (how the parts work together)
These are not separate indicators stacked in one pane. They are five reads of
the same question — "what is price doing and should I trust it?" — chosen
because they fail in different conditions, so combining them removes each
other's blind spots, and reading them across a full timeframe ladder removes the
blind spot of any single chart:
- TREND: an ATR SuperTrend blended with a moving-average stack. The SuperTrend
flips with less lag than a moving average alone; the stack confirms direction.
- MOMENTUM: MACD histogram + RSI + Stochastic. A three-oscillator read is harder
to whipsaw than any one of them.
- STRUCTURE: location of price within the recent range — acceptance in the
middle versus pressure at the edges.
- VOLUME FLOW: money-flow combined with position relative to the anchored VWAP,
i.e. whether price is above or below the session's volume-weighted fair value.
- MEAN-REVERSION: deviation from an adaptive equilibrium whose responsiveness
scales with the efficiency ratio. This is the counterweight that fades
extension — correct in a range, wrong in a trend.
Because a factor that helps in one regime hurts in another, the fusion is
governed by two layers that decide how much to trust each factor:
1. REGIME WEIGHTING. Each timeframe classifies its own regime from the
efficiency ratio, ADX and relative volatility, and reweights the factors
accordingly — trend and momentum lead in a trend, mean-reversion leads in a
range, and confidence is damped when volatility is elevated. A daily that is
trending and a 5-minute that is ranging are therefore scored by different
logic, which is the whole point of a multi-timeframe read.
2. PROVEN-ACCURACY WEIGHTING. The script tracks, on past bars only, how often
each individual factor's signal has been followed through on THIS symbol, and
scales that factor's weight by its measured hit-rate. So the fusion becomes
regime x proven-accuracy: on a symbol where, historically, mean-reversion has
paid and trend has not, the panel learns that and weights accordingly. This
is what turns a generic vote into a calibrated, symbol-aware read.
Two further layers handle the traps and the timing:
- EXHAUSTION. A fully-aligned stack that is also over-extended is the classic
"everything agrees right at the turn" trap. Exhausted timeframes are marked,
and the confluence meter is damped so that alignment-with-exhaustion is not
mistaken for high conviction.
- SQUEEZE. A read of where Bollinger bands sit inside Keltner channels —
volatility compression that tends to precede expansion. This adds timing
(when a move may start) to the directional read (which way).
The cross-timeframe layer then turns the nine composites into one verdict:
overall direction, a confluence meter, an alignment count, and a fast-versus-slow
transition flag. Calibration of the overall bias keeps the headline honest by
measuring its real follow-through on the current symbol.
HOW IT WORKS (mechanics, briefly)
Each timeframe's factors are computed with standard confirmation and requested
non-repainting; history does not change after the fact. The per-symbol accuracy
weights and the headline follow-through are built by recording a signal's
direction when it forms and checking, a fixed number of bars later, whether
price travelled a chosen ATR multiple in that direction, then aggregating into a
rate with a Wilson confidence interval. All thresholds are ATR-relative, so
nothing is tied to a particular price scale.
HOW TO USE
1. Read the headline bar (overall bias) and the CONFLUENCE meter, then scan the
Bias column down the ladder for a long aligned run.
2. A "!" on a Bias cell means that timeframe is exhausted; high alignment with
exhaustion is lower conviction, and the meter already reflects that.
3. Watch STATE (FULL STACK / TRANSITION) and the SQUEEZE row for timing.
4. Weight the read by FOLLOW-THROUGH — the overall bias's measured hit-rate here.
5. Everything is descriptive context, not a signal to act on.
USE ON ANY MARKET
The Price source input drives the trend, momentum, mean-reversion and structure
reads, so you can run the panel on standard candles, Heikin-Ashi, or another
price series across stocks, indices, futures, forex and crypto. High, low and
volume stay native for the range and flow factors, and a volume-borrow input
supplies volume for symbols that report none.
WHAT MAKES IT ORIGINAL
The contribution is the fusion, not the individual factors, which are standard.
Here the same regime-adaptive, volatility-normalised composite is computed
identically across a timeframe ladder, then weighted further by each factor's
past-only, per-symbol accuracy, with exhaustion damping and explicit alignment,
transition and squeeze context. A multi-timeframe panel that learns which
factors to trust on each symbol, and that damps alignment when a move is
exhausted, is the part that is not available elsewhere.
SETTINGS WORTH KNOWING
- Timeframe Ladder: the nine timeframes are editable.
- Fusion: toggle proven-accuracy weighting, exhaustion damping and the squeeze
read; the higher-timeframe emphasis slider controls how much slow timeframes
count in the overall (0 = equal weighting).
- Calibration: horizon and minimum follow-through define what counts as a
"followed-through" signal for both the accuracy weights and the headline rate.
- External signals (optional): three source inputs accept directional exports
from other indicators and blend them into the overall composite at the chart
timeframe; price sources are auto-ignored.
- Visuals: theme is auto/dark/light; size is Tiny/Small/Normal; the identity
strip shows the script name, symbol and timeframe.
NOTE ON TIMEFRAMES BELOW THE CHART
A timeframe lower than the chart returns its most recent value rather than a full
aggregated history. For a fully historical view of the fast rows, load the
indicator on a low chart timeframe; for a live current-state read, every row is
valid at any chart timeframe.
LIMITATIONS
Higher-timeframe values reflect the developing bar in real time; history is
non-repainting. Volume flow and anchored VWAP need real (or borrowed) volume. The
accuracy weighting and follow-through describe PAST behaviour only — they are not
a backtest and not a probability of future results. Every read is probabilistic
context, never a certainty.
DISCLAIMER
This is a study / indicator for chart analysis and education only. It is not a
strategy, not a recommendation, and not financial advice. It places no orders and
guarantees no outcome. Markets carry risk, and the past behaviour of a signal
does not assure its future behaviour. Do your own research and manage your own
risk.
Release Notes
Confluence Matrix — Multi‑Timeframe Market‑State CockpitWhat it is
A single panel that summarizes the state of a market across seven timeframes and turns it
into three plain‑language verdicts — Scalp, Intraday and Positional — each with a
confidence‑weighted score from −100 to +100. It is a market‑state gauge for context and
study. It is not a buy/sell signal and it is not financial advice.
What it does / what it shows
For each of seven timeframes (1m, 3m, 5m, 15m, 60m, 4H, 1D) it measures a compact set of
orthogonal factors — trend, trend‑quality, momentum, structure, volume‑flow and
mean‑reversion — and shows each as a coloured cell (green = up bias, red = down, brighter =
stronger; ▲/▼/·). Below the grid, a context strip measured on the chart timeframe shows
value/auction location, order‑flow toxicity and price‑impact, an options/positioning read, an
intermarket leader, order‑flow self‑excitation, the implied‑vs‑realized volatility premium,
and a statistical regime‑shift flag. Three decision rows convert all of this into Scalp /
Intraday / Positional verdicts with scores.
How it works (method)
Directional core. On every timeframe, six factors are computed independently: an EMA‑stack
plus a linear‑regression slope×R² trend, an Efficiency‑Ratio trend‑quality, an RSI‑based
momentum, a range‑location plus swing‑break structure, a Money‑Flow / bar‑delta
volume‑flow, and a z‑score mean‑reversion. A lightweight regime classifier (Efficiency
Ratio + ADX + range expansion) adapts the base weights per timeframe.
Adaptive weighting. Each core factor is logged forward on the chart timeframe and scored
against a base rate; its follow‑through "Edge" sets a weight multiplier, so factors that
have actually paid on the current instrument count more. Descriptive of past behaviour
(past‑only), not a backtest or a forward promise.
Context layer. On the chart timeframe: a volume‑weighted value/auction location; a bucketed
order‑flow‑toxicity estimate combined with a price‑impact estimate; an implied‑vol‑rank +
term + basis positioning composite; a correlation‑gated intermarket leader; a
self‑excitation (branching‑ratio) estimate; an implied‑vs‑realized volatility premium; and
a two‑sided CUSUM regime‑shift detector.
Fusion. Per‑timeframe composites are blended into three horizon composites (Scalp weights
the fast timeframes, Positional the slow), tilted slightly by the context's net direction,
then scaled by a confidence factor that is reduced when flow is toxic, self‑excitation is
high, volatility is stressed, or a regime shift is active.
Why this is one script, and how the components work together (mashup rationale)
The two groups are deliberately different in kind and they cross‑check each other, which is the
reason to combine them rather than run them separately. The core answers "which way"; the
context answers "how trustworthy." A strong, aligned core in calm, non‑toxic, non‑shifting
conditions produces a large confident score. The same aligned core during toxic flow, a
volatility spike, or a detected regime shift is mechanically de‑confidenced — the verdict
score shrinks — because the context layer feeds the confidence that scales every verdict.
Neither group alone gives you both direction and reliability: momentum can be strong precisely
when flow is most toxic; a clean trend can be one print away from a regime break. Fusing them
into one confidence‑weighted read is the point. The per‑factor forward‑Edge weighting ties the
two together further, letting evidence — not fixed settings — decide how much each core factor
contributes on the instrument you are actually viewing.
How to use it
Read the BIAS row across the seven timeframes for the multi‑timeframe lean.
Look at the three DECISION bars: the colour is the read for that horizon and the number is
its confidence‑weighted score. A large |score| means firm, aligned and confident; Mixed
means no clear edge — nothing to do.
Treat gold anywhere as caution: high volatility, toxic flow, or a regime shift.
It works on any market: open "① Data Sources" and set the futures, spot, leader and
implied‑volatility symbols to your instrument, or switch those context cells off. Defaults
target NSE NIFTY. Every context cell also accepts your own external input.
Enable the built‑in Info panel (Dashboard & Theme → Info panel) for an on‑chart how‑to.
What makes it original
It is not a repackaged single indicator. The original contribution is the specific
combination: a seven‑timeframe orthogonal core whose factors are adaptively weighted by their
own measured forward follow‑through on the current symbol, fused with a chart‑timeframe context
layer into three horizon verdicts whose scores are damped by a context‑derived confidence. The
flow‑quality cell pairing toxicity with price‑impact, and the confidence coupling that shrinks
"aligned but fragile" reads, are the distinguishing design choices.
Credits (established public methods used)
Efficiency Ratio — Perry Kaufman. RSI / ATR / DMI — J. Welles Wilder. Money Flow Index — Quong
& Soudack. Linear‑regression channel — classical. Order‑flow toxicity (VPIN) — Easley, López
de Prado & O'Hara (2012). Price impact (lambda) — Albert Kyle (1985). Self‑excitation /
branching ratio — Hawkes (1971); Hardiman, Bercot & Bouchaud (2013). Variance‑risk premium —
Bollerslev, Tauchen & Zhou (2009). Auction / value‑area — J. Peter Steidlmayer (Market
Profile). Change‑point (CUSUM) — E. S. Page (1954). Adaptive forward‑weighting — after
meta‑labeling / triple‑barrier concepts, López de Prado (2018).
Limitations (please read)
Higher‑timeframe cells reflect the developing higher‑timeframe bar. Volume and order‑flow are
estimated from price and bar volume, not exchange‑tagged trades — on markets without volume,
set a borrow symbol or switch flow cells off. Context and Edge are chart‑timeframe only. The
Edge weighting is descriptive of past behaviour, not a backtest. A sub‑bar timeframe below the
chart is used for flow; if unavailable, the panel falls back to a bar proxy.
Disclaimer
For study and education only. This is NOT financial, investment or trading advice, NOT a
recommendation, and NOT a signal to buy or sell. It places no orders and makes no guarantees.
Markets involve risk of loss; past behaviour does not assure future results. Always do your own
research and manage your own risk.
Open-source script
In true TradingView spirit, the creator of this script has made it open-source, so that traders can review and verify its functionality. Kudos to the author! While you can use it for free, remember that republishing the code is subject to our House Rules.

Disclaimer
The information and publications are not meant to be, and do not constitute, financial, investment, trading, or other types of advice or recommendations supplied or endorsed by TradingView. Read more in the Terms of Use.
Open-source script
In true TradingView spirit, the creator of this script has made it open-source, so that traders can review and verify its functionality. Kudos to the author! While you can use it for free, remember that republishing the code is subject to our House Rules.
Disclaimer
The information and publications are not meant to be, and do not constitute, financial, investment, trading, or other types of advice or recommendations supplied or endorsed by TradingView. Read more in the Terms of Use.