3dge Trend
3dge Trend
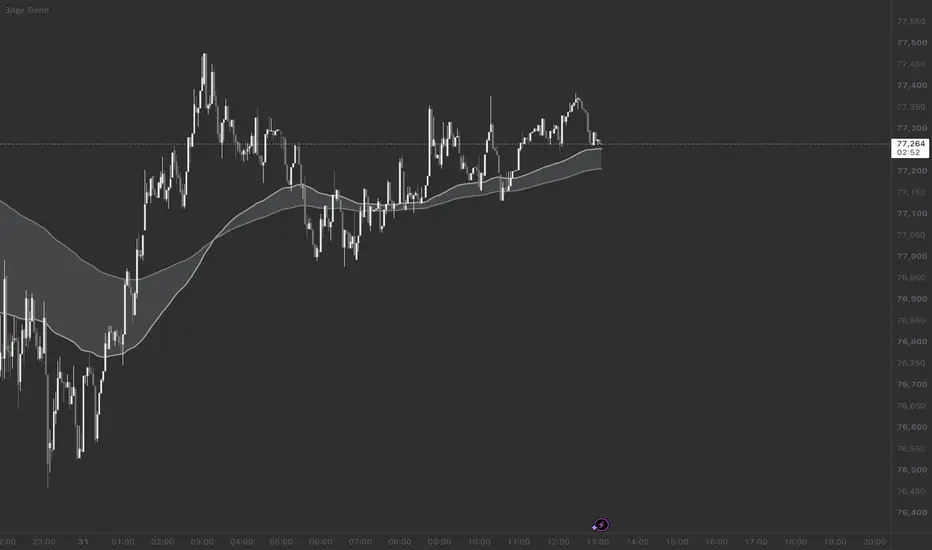
3dge Trend plots the EMA 100 and EMA 200 as a single ribbon to give a clean, uncluttered view of the market’s longer-term trend structure.
How it works
Two exponential moving averages are calculated: a fast EMA (100) and a slow EMA (200).
The area between them is filled to form a ribbon, making the relationship between the two EMAs easy to read at a glance.
When the fast EMA is above the slow EMA, the longer-term structure is bullish. When it is below, the structure is bearish. When the two lines are tightly compressed and moving sideways, the market is ranging.
Price above the ribbon shows strength relative to the trend. Price inside or below it shows weakness or a pullback.
Timeframe modes
Follow Chart (default): the EMAs are calculated on the timeframe you are viewing and update automatically when you switch timeframes.
Fixed Timeframe: the EMAs are always calculated on a timeframe you choose (for example Weekly) and projected onto any lower timeframe chart. With “Confirmed candles only” enabled, values come from the last closed higher-timeframe candle, so they do not repaint.
Settings
Fast and slow EMA lengths and source
Line colors, line width, fill color and fill transparency (neutral gray by default)
Notes
3dge Trend is a context tool, not a buy/sell signal. Use it to define trend bias and key dynamic levels, and combine it with your own entry rules and risk management. This script is for educational purposes and does not constitute financial advice.
3dge Trend plots the EMA 100 and EMA 200 as a single ribbon to give a clean, uncluttered view of the market’s longer-term trend structure.
How it works
Two exponential moving averages are calculated: a fast EMA (100) and a slow EMA (200).
The area between them is filled to form a ribbon, making the relationship between the two EMAs easy to read at a glance.
When the fast EMA is above the slow EMA, the longer-term structure is bullish. When it is below, the structure is bearish. When the two lines are tightly compressed and moving sideways, the market is ranging.
Price above the ribbon shows strength relative to the trend. Price inside or below it shows weakness or a pullback.
Timeframe modes
Follow Chart (default): the EMAs are calculated on the timeframe you are viewing and update automatically when you switch timeframes.
Fixed Timeframe: the EMAs are always calculated on a timeframe you choose (for example Weekly) and projected onto any lower timeframe chart. With “Confirmed candles only” enabled, values come from the last closed higher-timeframe candle, so they do not repaint.
Settings
Fast and slow EMA lengths and source
Line colors, line width, fill color and fill transparency (neutral gray by default)
Notes
3dge Trend is a context tool, not a buy/sell signal. Use it to define trend bias and key dynamic levels, and combine it with your own entry rules and risk management. This script is for educational purposes and does not constitute financial advice.

Disclaimer
The information and publications are not meant to be, and do not constitute, financial, investment, trading, or other types of advice or recommendations supplied or endorsed by TradingView. Read more in the Terms of Use.
Disclaimer
The information and publications are not meant to be, and do not constitute, financial, investment, trading, or other types of advice or recommendations supplied or endorsed by TradingView. Read more in the Terms of Use.