Updated
[blackcat] L2 Ehlers Hilbert Transformer Indicator
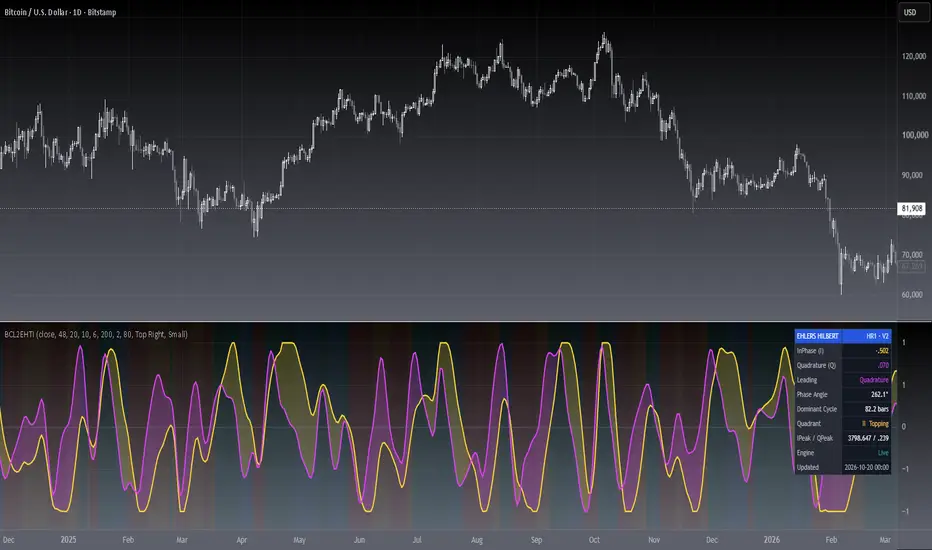
Level: 2
Background
John F. Ehlers introuced Hilbert Transformer Indicator in his "Cycle Analytics for Traders" chapter 14 on 2013.
Function
Basically, the real component moves with the general direction of the prices, and the imaginary component is a predictive indicator for the real component in the same sense that a cosine wave is a predictor of a sine wave. Although the default LPPeriod input is set to 20 bars in an attempt to smooth the indicator the imaginary component is still too erratic to be useful.
Key Signal
Imag --> Quadrature phase output signal
Real --> In-phase output signal
Pros and Cons
100% John F. Ehlers definition translation, even variable names are the same. This help readers who would like to use pine to read his book.
Remarks
The 58th script for Blackcat1402 John F. Ehlers Week publication.
Readme
In real life, I am a prolific inventor. I have successfully applied for more than 60 international and regional patents in the past 12 years. But in the past two years or so, I have tried to transfer my creativity to the development of trading strategies. Tradingview is the ideal platform for me. I am selecting and contributing some of the hundreds of scripts to publish in Tradingview community. Welcome everyone to interact with me to discuss these interesting pine scripts.
The scripts posted are categorized into 5 levels according to my efforts or manhours put into these works.
Level 1 : interesting script snippets or distinctive improvement from classic indicators or strategy. Level 1 scripts can usually appear in more complex indicators as a function module or element.
Level 2 : composite indicator/strategy. By selecting or combining several independent or dependent functions or sub indicators in proper way, the composite script exhibits a resonance phenomenon which can filter out noise or fake trading signal to enhance trading confidence level.
Level 3 : comprehensive indicator/strategy. They are simple trading systems based on my strategies. They are commonly containing several or all of entry signal, close signal, stop loss, take profit, re-entry, risk management, and position sizing techniques. Even some interesting fundamental and mass psychological aspects are incorporated.
Level 4 : script snippets or functions that do not disclose source code. Interesting element that can reveal market laws and work as raw material for indicators and strategies. If you find Level 1~2 scripts are helpful, Level 4 is a private version that took me far more efforts to develop.
Level 5 : indicator/strategy that do not disclose source code. private version of Level 3 script with my accumulated script processing skills or a large number of custom functions. I had a private function library built in past two years. Level 5 scripts use many of them to achieve private trading strategy.
Background
John F. Ehlers introuced Hilbert Transformer Indicator in his "Cycle Analytics for Traders" chapter 14 on 2013.
Function
Basically, the real component moves with the general direction of the prices, and the imaginary component is a predictive indicator for the real component in the same sense that a cosine wave is a predictor of a sine wave. Although the default LPPeriod input is set to 20 bars in an attempt to smooth the indicator the imaginary component is still too erratic to be useful.
Key Signal
Imag --> Quadrature phase output signal
Real --> In-phase output signal
Pros and Cons
100% John F. Ehlers definition translation, even variable names are the same. This help readers who would like to use pine to read his book.
Remarks
The 58th script for Blackcat1402 John F. Ehlers Week publication.
Readme
In real life, I am a prolific inventor. I have successfully applied for more than 60 international and regional patents in the past 12 years. But in the past two years or so, I have tried to transfer my creativity to the development of trading strategies. Tradingview is the ideal platform for me. I am selecting and contributing some of the hundreds of scripts to publish in Tradingview community. Welcome everyone to interact with me to discuss these interesting pine scripts.
The scripts posted are categorized into 5 levels according to my efforts or manhours put into these works.
Level 1 : interesting script snippets or distinctive improvement from classic indicators or strategy. Level 1 scripts can usually appear in more complex indicators as a function module or element.
Level 2 : composite indicator/strategy. By selecting or combining several independent or dependent functions or sub indicators in proper way, the composite script exhibits a resonance phenomenon which can filter out noise or fake trading signal to enhance trading confidence level.
Level 3 : comprehensive indicator/strategy. They are simple trading systems based on my strategies. They are commonly containing several or all of entry signal, close signal, stop loss, take profit, re-entry, risk management, and position sizing techniques. Even some interesting fundamental and mass psychological aspects are incorporated.
Level 4 : script snippets or functions that do not disclose source code. Interesting element that can reveal market laws and work as raw material for indicators and strategies. If you find Level 1~2 scripts are helpful, Level 4 is a private version that took me far more efforts to develop.
Level 5 : indicator/strategy that do not disclose source code. private version of Level 3 script with my accumulated script processing skills or a large number of custom functions. I had a private function library built in past two years. Level 5 scripts use many of them to achieve private trading strategy.
Release Notes
OVERVIEW The [blackcat] L2 Ehlers Hilbert Transformer Indicator applies advanced signal processing techniques to analyze market cycles and trends. It generates in-phase and quadrature components for comprehensive market analysis.FEATURES
• Advanced Hilbert Transform implementation
• Dual-component visualization:
InPhase (Real Part)
Quadrature (Imaginary Part) • Adjustable low-pass period parameter • Color-coded fill area for trend direction • Adaptive filtering for noise reduction
HOW TO USE
Input Parameters:
• LPPeriod: Sets the low-pass filter period length
Interpretation:
• Yellow fill: Indicates positive cycle dominance
• Fuchsia fill: Indicates negative cycle dominance
• Component crossings suggest potential turning points
LIMITATIONS
• Requires sufficient historical data for accurate calculations
• May lag during rapid price movements
• Best used in conjunction with other indicators
NOTES
• The script uses Ehlers' adaptive filtering methodology
• The Hilbert Transform helps identify market cycles and phases
• The visualization combines both components for comprehensive analysis
Release Notes
█ OVERVIEWEhlers Hilbert Transformer splits detrended price into an In-Phase (I) and a
Quadrature (Q) component, so you observe the cyclic state of the market instead of
the price itself. The pane also reports phase angle, dominant cycle length and the
active phase quadrant in a compact status table.
█ CONCEPTS
John Ehlers' Hilbert transformer converts the detrended price into a pair of
orthogonal series. In-Phase shows where the cycle currently is; Quadrature, its
normalized first difference, leads by roughly a quarter of a cycle and therefore
turns before price does.
• I leads Q: the cycle still expands in the direction of I
• Q leads I: an inflection is already underway — early information about a turn
• Both stay inside -1 to +1 through adaptive peak normalization, so readings are
comparable across symbols and volatility regimes
• Phase 0-360° locates the position inside the cycle; the dominant cycle in bars
tells how long the current swing typically lasts
This is a research and context tool, not a signal generator: no buy or sell labels
are painted on the chart.
█ HOW TO USE
1 — Apply on any liquid symbol and timeframe; values are normalized
2 — Watch the fill color: warm = In-Phase leads, cool = Quadrature leads
3 — Read the status table for current I, Q, phase and cycle length
4 — Compare the dominant cycle with your moving averages: if the measured cycle is
close to half of your MA length, the averages are mistuned
5 — Optional alerts fire when Quadrature crosses zero
Input parameters
• Source: price series used, default close
• High-Pass Period: trend removal cutoff, default 48
• LPPeriod: Super Smoother period, default 20; lower is faster
• Quadrature Smoothing: smoothing applied to Q, default 10
• Min / Max Dominant Cycle: clamps the period estimate
• Visuals: colors, line width, fill transparency, peak envelope, quadrant
background, warm-up suppression
• Status Table: show/hide, position, text size
█ FEATURES
• Adaptive peak normalization with stable, non-NA output
• Warm-up detection — leading bars are hidden instead of showing filter noise
• Quadrant background tint: rising, topping, falling, bottoming
• Optional ±IPeak amplitude envelope
• Nine-row status table refreshed only on the last bar
• Two alert conditions on the quadrature zero cross
█ VISUALS
• In-Phase line (yellow by default): cycle position
• Quadrature line (fuchsia by default): leading component
• Fill between both lines: color follows the leading component
• Table rows: InPhase, Quadrature, Leading, Phase Angle, Dominant Cycle,
Quadrant, IPeak/QPeak, Engine state, last update time
█ IMPLEMENTATION NOTES
Two-pole high-pass filter, then Super Smoother low-pass, adaptive peak
normalization, first difference, second Super Smoother. Phase uses the four-step
rotation and period = 360 / phase step, clamped and smoothed. Every series is
computed unconditionally on each bar; no request.security, no repainting.
█ LIMITATIONS
• Only meaningful when a cycle exists; in strong trends the period estimate
saturates at the clamp values
• Filter warm-up needs roughly 70 bars of history
• Normalization hides absolute amplitude — read the envelope row for size
• Not a trading system; combine with market structure and risk management
█ NOTES
• Original concept: John F. Ehlers, Rocket Science for Traders
• Version 2: division guards, exposed parameters, phase and period readout,
status table
• Attribution appreciated if you reuse the code
═════════════════════════════════════════════════════════════════════════
For questions or feedback, use the comments section below.

Don't miss out! The first and most important thing to do is to join my Discord chat now! Click here to start your adventure: discord.com/invite/ZTGpQJq My new github for more pine development soon: github.com/wxt-coder
Disclaimer
The information and publications are not meant to be, and do not constitute, financial, investment, trading, or other types of advice or recommendations supplied or endorsed by TradingView. Read more in the Terms of Use.
Don't miss out! The first and most important thing to do is to join my Discord chat now! Click here to start your adventure: discord.com/invite/ZTGpQJq My new github for more pine development soon: github.com/wxt-coder
Disclaimer
The information and publications are not meant to be, and do not constitute, financial, investment, trading, or other types of advice or recommendations supplied or endorsed by TradingView. Read more in the Terms of Use.