OPEN-SOURCE SCRIPT
Updated Lead-Lag Information Flow
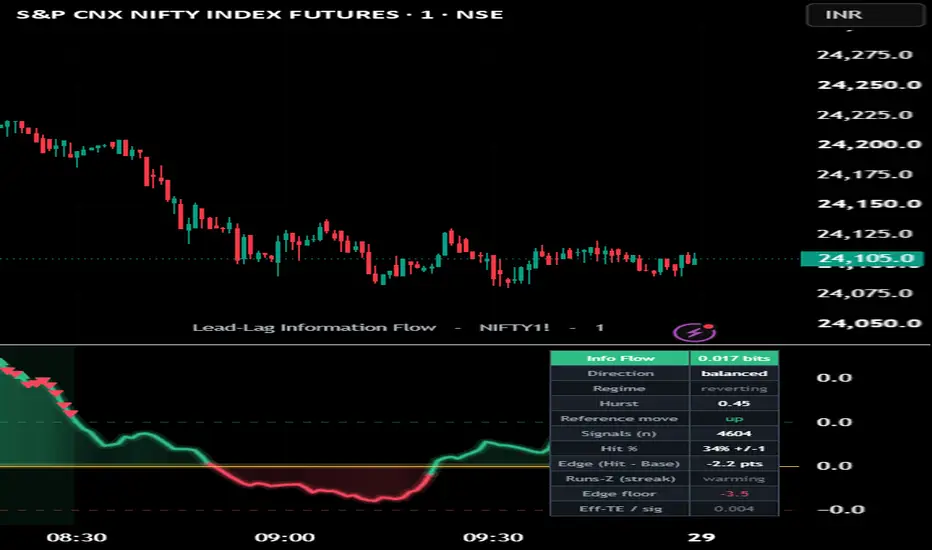
Lead-Lag Information Flow
OVERVIEW
Correlation tells you two instruments move together. It cannot tell you who moves first. This indicator answers that question directly: it measures the net directional information flow between a reference symbol and the chart using transfer entropy — how much knowing the reference's last move reduces uncertainty about the chart's next move, beyond what the chart's own history already says, minus the same quantity in the other direction.
The result plots around zero. Positive = the reference leads the chart; negative = the chart leads the reference. A regime read (is the follower trending or chopping?) sits alongside it, because a lead is only worth acting on when the follower is in a state that lets the move pay off.
WHY THESE COMPONENTS BELONG IN ONE SCRIPT (mashup rationale)
Three parts, one question — is there exploitable lead-lag right now, and which way? Each closes a gap the others leave open:
Transfer entropy (net, in bits) answers the DIRECTION of information — who leads. It is model-free and captures nonlinear lead-lag that a correlation or linear regression misses, and netting the two directions cancels much of the small-sample bias that distorts raw entropy estimates.
The Hurst regime read answers whether a lead is tradeable: information flowing into a persistent (trending) follower is far more actionable than into a mean-reverting chop. The same lead means different things in different regimes.
The calibration harness answers whether it has actually worked here: it logs each lead-and-follow setup and, a fixed horizon later, checks whether the chart moved with the leader by at least k × ATR, reporting Hit %, Base %, and Edge.
Direction without a regime filter fires into noise; a regime read without direction is just a Hurst line; either without calibration is an untested assertion. Together they form one decision — lead exists (entropy) and the follower can run (regime) and it has paid before (Edge). Remove any one and the question is answered less completely.
HOW IT WORKS
Each series' bar-to-bar move is reduced to an up/down state.
Over a rolling window, state-transition frequencies estimate the transfer entropy in each direction (Schreiber's estimator); the plotted line is the net (reference→chart minus chart→reference), in bits. An optional Miller-Madow finite-sample correction subtracts the small-sample bias raw entropy estimates carry on short windows — a streaming-feasible step toward effective transfer entropy.
A Hurst exponent (a structure-function estimate around the 0.5 line) classifies the follower's regime as trending or reverting.
A follow setup arms when net flow says the reference leads and the reference has just moved; the calibration harness then measures whether the chart followed.
HOW TO USE
Read the line for direction — above the upper threshold, the reference leads; below the lower threshold, the chart leads — and read the dashboard for regime and the Edge row. A lead into a trending follower with a positive, matured Edge is the context this tool is built to surface. A lead into a reverting follower, or one where Edge sits near zero, is the engine telling you the lead-lag is not exploitable on this pair and timeframe. The background tints faintly green when the reference leads decisively and red when the chart leads. Treat all of this as context, never a standalone trigger.
Three visual styles are provided (Gradient area + glow / Histogram / Line); the gradient area's intensity scales with how strong the net flow is.
UNIVERSAL ACROSS MARKETS
The chart is the follower; the Reference symbol is the candidate leader — both are inputs, so the engine runs on any related pair in any market: cash index vs its futures, an index vs a lead constituent, an asset vs its dominant driver. Defaults pair NSE:NIFTY (cash) as the candidate leader against a NIFTY-futures chart; change the reference for any other pair. Use it on the timeframe at which you expect the lead-lag to operate.
ORIGINALITY
The techniques are public and credited below. The original work is the integration: a streaming two-state transfer-entropy estimator that nets the two directions and applies a Miller-Madow finite-sample correction to approximate effective transfer entropy (the documented fix for small-sample bias) without the shuffle step that a streaming script can't perform, gated by a Hurst regime classifier so a lead is only surfaced where the follower can act on it, and tied to a forward base-rate calibration so every follow setup reports its own realized Edge rather than an asserted one. No third-party Pine code is reused.
CONCEPT CREDIT
Transfer entropy — Thomas Schreiber (2000); effective transfer entropy and small-sample bias correction — Marschinski & Kantz (2002). Finite-sample entropy correction — Miller (1955) / Madow. Information entropy — Claude E. Shannon (1948). Hurst exponent — Harold E. Hurst (1951); long-memory framing — Benoit Mandelbrot. Not affiliated with, nor endorsed by, any third party.
HONESTY / LIMITATIONS
This is a coarse, two-state, windowed estimator. The finite-sample (Miller-Madow) correction and the netting of the two directions together approximate effective transfer entropy — they reduce the small-sample bias raw TE carries — but they are not a full surrogate-shuffle effective TE with significance testing (which requires reshuffling that isn't possible in a streaming script). The Edge figures are in-sample, close-to-close, with overlapping forward windows and no costs — descriptive context, not a verified backtest. An Edge near zero or negative is the harness honestly reporting that the lead-lag is not exploitable here; do not tune until it turns green — that is curve-fitting. The reference must be a genuinely related instrument for the read to mean anything. Nothing here predicts price.
DISCLAIMER
Research and educational tool only. NOT financial advice and NO guarantee of profitability or accuracy. Indicators describe past behaviour; they do not predict the future. Trading carries risk of loss. Test out-of-sample and make your own decisions. The author accepts no liability for any use of this script.
Release Notes
Lead-Lag Information FlowWhat it is. A directional information-flow read between a reference series and price — an estimate of which is leading, using an information-theoretic (transfer-entropy-style) measure rather than simple correlation.
What's new in this update
Effective, significance-gated flow. The net flow is now baseline-subtracted and standardized against its own recent distribution, and a "lead" is only emitted when it is statistically prominent (beyond a set number of standard deviations). This is the streaming-feasible approximation of an effective/surrogate-corrected measure — it suppresses small, ambiguous readings.
Calibration honesty layer: event-sampling, streak-dependence check and confidence floor.
How the parts work together. The raw information-flow estimate is inherently noisy; the baseline subtraction and significance gate are what make a "lead" call meaningful rather than a flicker. The reader sees both the continuous flow and the gated, significant-only version.
Reusable outputs. Effective net flow, the significance-gated lead, the reference-vs-price direction and the calibration edge/floor are published to the Data Window with generic names.
Defaults & sources. The reference series is configurable (point it at a leading market, sector, or breadth proxy); windows are NIFTY-tuned.
Educational only — a coarse symbolic estimator; the gate reduces but does not remove false reads. Not financial advice.
Open-source script
In true TradingView spirit, the creator of this script has made it open-source, so that traders can review and verify its functionality. Kudos to the author! While you can use it for free, remember that republishing the code is subject to our House Rules.

Disclaimer
The information and publications are not meant to be, and do not constitute, financial, investment, trading, or other types of advice or recommendations supplied or endorsed by TradingView. Read more in the Terms of Use.
Open-source script
In true TradingView spirit, the creator of this script has made it open-source, so that traders can review and verify its functionality. Kudos to the author! While you can use it for free, remember that republishing the code is subject to our House Rules.
Disclaimer
The information and publications are not meant to be, and do not constitute, financial, investment, trading, or other types of advice or recommendations supplied or endorsed by TradingView. Read more in the Terms of Use.