OPEN-SOURCE SCRIPT
Dynamic SMC & Market Structure PRO
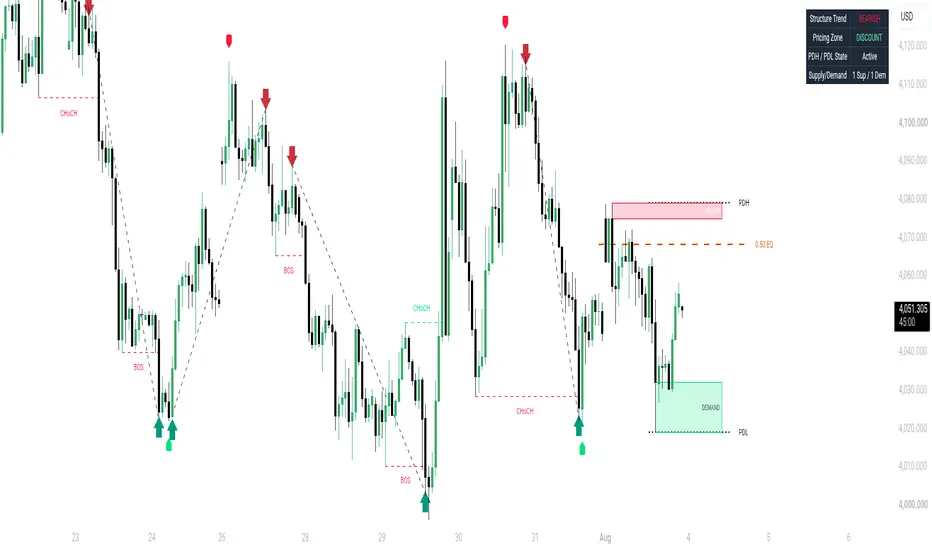
Dynamic SMC and Market Structure PRO
Dynamic SMC and Market Structure PRO is a comprehensive technical analysis tool designed for price action traders and Smart Money Concepts practitioners. It focuses on mapping structural context, tracking key daily and session liquidity levels, and highlighting major market turning points without cluttering your chart.
Key Features Overview
1. Major Swing Extreme Highlights
Automatically identifies major market peaks and bottoms. Major highs are highlighted with clean red shapes and major lows with clean green shapes. This gives traders an instant visual reading of macro market extremes.
2. Smart Money Structure Engine
Tracks real time market context by automatically identifying Break of Structure (BOS) for trend continuation and Change of Character (CHoCH) for potential trend reversals on valid swing points.
3. Dynamic Supply and Demand Zones
Plots high probability supply and demand areas directly on your chart. These dynamic zones automatically adjust and disappear as soon as price breaks through them, ensuring your charting area stays clean.
4. Auto Disappearing Previous Day High and Low
Projects active Previous Day High (PDH) and Previous Day Low (PDL) levels. As soon as price breaks or sweeps these daily liquidity boundaries, the lines automatically delete to keep focus on active price action.
5. Auto Disappearing Session Liquidity
Tracks Asian session highs and lows. Includes a smart proximity filter that prevents visual clutter when session levels align closely with daily highs or lows. Lines automatically disappear when swept by price.
6. Fibonacci 0.5 Equilibrium Range
Calculates the 50 percent Fibonacci Equilibrium line across recent price swings. This helps traders easily distinguish between Premium zones above 50 percent and Discount zones below 50 percent.
7. Clean Dashboard Panel
Displays an on screen information panel summarizing current structure trend, pricing zone state, daily liquidity sweep status, and active supply or demand zone counts.
How to Use
Step 1: Determine Structural Context
Check the market structure labels (BOS/CHoCH) and the Dashboard Panel to determine whether the market is currently in a bullish or bearish structure trend.
Step 2: Identify Premium vs Discount Pricing
Use the 0.5 Equilibrium Line to contextualize price position:
- Premium Zone (Above 0.5 EQ): Ideal area to evaluate short setups near active Supply Zones or recent Major High shapes.
- Discount Zone (Below 0.5 EQ): Ideal area to evaluate long setups near active Demand Zones or recent Major Low shapes.
Step 3: Monitor Liquidity Sweeps
Watch how price interacts with Previous Day High/Low and Session High/Low levels. When price sweeps one of these levels and the line disappears, look for a CHoCH reaction for potential reversal setups.
Step 4: Execute on Zone Reactions
Evaluate price action inside active Supply and Demand zones. When price enters a zone in alignment with the broader structural trend, look for lower timeframe confirmation.
Settings Overview
Major Swing Extremes Settings
- Show Major Swing High/Low Shapes: Toggle visibility of major high and low shapes.
- Major Swing Lookback Sensitivity: Adjusts the pivot lookback length used to detect major market extremes.
Smart Money Structure Settings
- Show BOS and CHoCH Lines: Toggle visibility of structural break lines and text tags.
- Structure Sensitivity (Pivot Length): Controls how sensitive the script is to structural swing points.
Dynamic Supply and Demand Settings
- Show Dynamic Supply and Demand Zones: Toggle display of active supply and demand boxes.
- Max Active Zones Per Side: Controls the maximum number of active supply or demand zones displayed simultaneously.
- Zone Transparency: Adjusts the color opacity of the supply and demand boxes.
Auto Disappearing PDH and PDL Settings
- Show Active PDH / PDL: Toggle display of Previous Day High and Low lines.
Session Highs and Lows Settings
- Show Session High/Low Lines: Toggle display of session liquidity lines.
- Clutter Distance Threshold: Sets the distance threshold in pips or points to prevent overlapping lines when levels are close.
Fibonacci Equilibrium Settings
- Show 0.5 Equilibrium Line: Toggle display of the 50 percent mid point level.
- Equilibrium Lookback Range: Adjusts the lookback period used for calculating recent swing highs and lows.
Pro Tips for Effective Usage
Tip 1: Trade in Alignment with Macro Extremes
Higher probability trade setups occur when price retests a Demand Zone near a Green Major Low shape, or a Supply Zone near a Red Major High shape.
Tip 2: Multi Timeframe Alignment
Mark major structure and supply/demand zones on higher timeframes like 1 Hour or 4 Hour, then switch to lower timeframes like 5 Min or 15 Min for CHoCH entry confirmation.
Tip 3: Pay Attention to Swept Levels
When a PDH or Session High line disappears after price spikes through it, observe if price quickly reverses back inside the range. This often signals institutional liquidity hunting.
Things to Avoid
1. Avoid Entering Inside Invalidated Zones
Do not trade setups from supply or demand zones that have already been broken through by price closes.
2. Avoid Counter Trend Entries at Equilibrium
Do not take aggressive short entries right at the 0.5 Equilibrium line when the market is making strong consecutive bullish BOS breaks.
3. Avoid Over Sensitivity on Low Timeframes
Do not use extremely low pivot lookback settings on sub minute charts to avoid unnecessary noise in structure detection.
Disclaimer
This tool is built strictly for educational and analytical purposes. It does not offer financial advice, trade signals, or guaranteed outcomes. Always practice proper risk management.
Dynamic SMC and Market Structure PRO is a comprehensive technical analysis tool designed for price action traders and Smart Money Concepts practitioners. It focuses on mapping structural context, tracking key daily and session liquidity levels, and highlighting major market turning points without cluttering your chart.
Key Features Overview
1. Major Swing Extreme Highlights
Automatically identifies major market peaks and bottoms. Major highs are highlighted with clean red shapes and major lows with clean green shapes. This gives traders an instant visual reading of macro market extremes.
2. Smart Money Structure Engine
Tracks real time market context by automatically identifying Break of Structure (BOS) for trend continuation and Change of Character (CHoCH) for potential trend reversals on valid swing points.
3. Dynamic Supply and Demand Zones
Plots high probability supply and demand areas directly on your chart. These dynamic zones automatically adjust and disappear as soon as price breaks through them, ensuring your charting area stays clean.
4. Auto Disappearing Previous Day High and Low
Projects active Previous Day High (PDH) and Previous Day Low (PDL) levels. As soon as price breaks or sweeps these daily liquidity boundaries, the lines automatically delete to keep focus on active price action.
5. Auto Disappearing Session Liquidity
Tracks Asian session highs and lows. Includes a smart proximity filter that prevents visual clutter when session levels align closely with daily highs or lows. Lines automatically disappear when swept by price.
6. Fibonacci 0.5 Equilibrium Range
Calculates the 50 percent Fibonacci Equilibrium line across recent price swings. This helps traders easily distinguish between Premium zones above 50 percent and Discount zones below 50 percent.
7. Clean Dashboard Panel
Displays an on screen information panel summarizing current structure trend, pricing zone state, daily liquidity sweep status, and active supply or demand zone counts.
How to Use
Step 1: Determine Structural Context
Check the market structure labels (BOS/CHoCH) and the Dashboard Panel to determine whether the market is currently in a bullish or bearish structure trend.
Step 2: Identify Premium vs Discount Pricing
Use the 0.5 Equilibrium Line to contextualize price position:
- Premium Zone (Above 0.5 EQ): Ideal area to evaluate short setups near active Supply Zones or recent Major High shapes.
- Discount Zone (Below 0.5 EQ): Ideal area to evaluate long setups near active Demand Zones or recent Major Low shapes.
Step 3: Monitor Liquidity Sweeps
Watch how price interacts with Previous Day High/Low and Session High/Low levels. When price sweeps one of these levels and the line disappears, look for a CHoCH reaction for potential reversal setups.
Step 4: Execute on Zone Reactions
Evaluate price action inside active Supply and Demand zones. When price enters a zone in alignment with the broader structural trend, look for lower timeframe confirmation.
Settings Overview
Major Swing Extremes Settings
- Show Major Swing High/Low Shapes: Toggle visibility of major high and low shapes.
- Major Swing Lookback Sensitivity: Adjusts the pivot lookback length used to detect major market extremes.
Smart Money Structure Settings
- Show BOS and CHoCH Lines: Toggle visibility of structural break lines and text tags.
- Structure Sensitivity (Pivot Length): Controls how sensitive the script is to structural swing points.
Dynamic Supply and Demand Settings
- Show Dynamic Supply and Demand Zones: Toggle display of active supply and demand boxes.
- Max Active Zones Per Side: Controls the maximum number of active supply or demand zones displayed simultaneously.
- Zone Transparency: Adjusts the color opacity of the supply and demand boxes.
Auto Disappearing PDH and PDL Settings
- Show Active PDH / PDL: Toggle display of Previous Day High and Low lines.
Session Highs and Lows Settings
- Show Session High/Low Lines: Toggle display of session liquidity lines.
- Clutter Distance Threshold: Sets the distance threshold in pips or points to prevent overlapping lines when levels are close.
Fibonacci Equilibrium Settings
- Show 0.5 Equilibrium Line: Toggle display of the 50 percent mid point level.
- Equilibrium Lookback Range: Adjusts the lookback period used for calculating recent swing highs and lows.
Pro Tips for Effective Usage
Tip 1: Trade in Alignment with Macro Extremes
Higher probability trade setups occur when price retests a Demand Zone near a Green Major Low shape, or a Supply Zone near a Red Major High shape.
Tip 2: Multi Timeframe Alignment
Mark major structure and supply/demand zones on higher timeframes like 1 Hour or 4 Hour, then switch to lower timeframes like 5 Min or 15 Min for CHoCH entry confirmation.
Tip 3: Pay Attention to Swept Levels
When a PDH or Session High line disappears after price spikes through it, observe if price quickly reverses back inside the range. This often signals institutional liquidity hunting.
Things to Avoid
1. Avoid Entering Inside Invalidated Zones
Do not trade setups from supply or demand zones that have already been broken through by price closes.
2. Avoid Counter Trend Entries at Equilibrium
Do not take aggressive short entries right at the 0.5 Equilibrium line when the market is making strong consecutive bullish BOS breaks.
3. Avoid Over Sensitivity on Low Timeframes
Do not use extremely low pivot lookback settings on sub minute charts to avoid unnecessary noise in structure detection.
Disclaimer
This tool is built strictly for educational and analytical purposes. It does not offer financial advice, trade signals, or guaranteed outcomes. Always practice proper risk management.
Open-source script
In true TradingView spirit, the creator of this script has made it open-source, so that traders can review and verify its functionality. Kudos to the author! While you can use it for free, remember that republishing the code is subject to our House Rules.

Follow The Trend Not The Crowd
Free Telegram Channel
t.me/+M7U84ec7_HYxMjU0
Free Telegram Channel
t.me/+M7U84ec7_HYxMjU0
Disclaimer
The information and publications are not meant to be, and do not constitute, financial, investment, trading, or other types of advice or recommendations supplied or endorsed by TradingView. Read more in the Terms of Use.
Open-source script
In true TradingView spirit, the creator of this script has made it open-source, so that traders can review and verify its functionality. Kudos to the author! While you can use it for free, remember that republishing the code is subject to our House Rules.
Follow The Trend Not The Crowd
Free Telegram Channel
t.me/+M7U84ec7_HYxMjU0
Free Telegram Channel
t.me/+M7U84ec7_HYxMjU0
Disclaimer
The information and publications are not meant to be, and do not constitute, financial, investment, trading, or other types of advice or recommendations supplied or endorsed by TradingView. Read more in the Terms of Use.