Options IV Sigma Levels Lite [Strikeline]
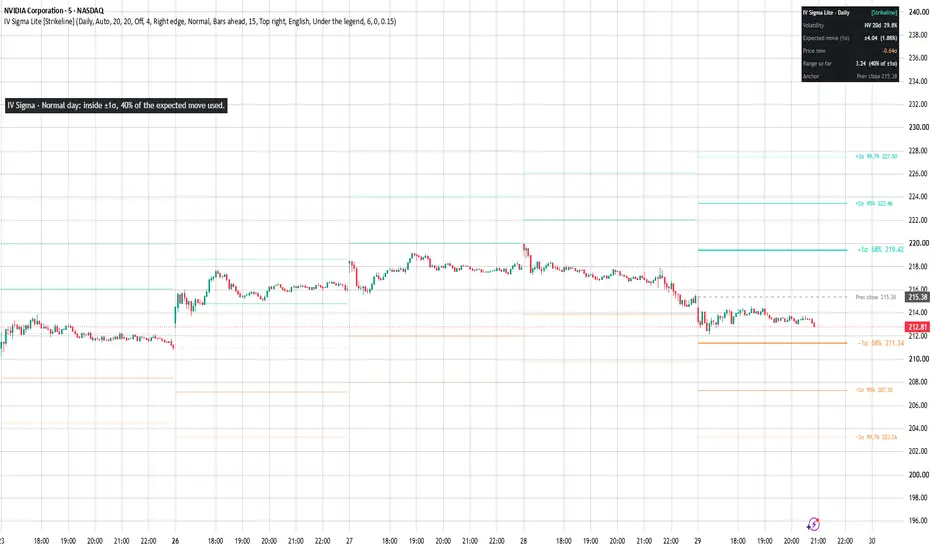
Options IV Sigma Levels Lite draws the range the options market is pricing for the day, the week or the month, and tells you in one plain line where price sits inside it.
WORKS ON
Any symbol: stocks, ETFs, indices, futures, forex and crypto. Index products (SPX/SPY, NDX/QQQ, RUT/IWM) use their own volatility index; everything else uses the symbol's historical volatility, or a manual IV.
WHAT IT DRAWS
• A dashed line at the anchor: the previous period's close (yesterday for Daily, last Friday for Weekly, last month's close for Monthly).
• Solid lines at ±1σ and ±2σ, and dotted lines at ±3σ.
±1σ ≈ 68% of periods stay inside: the edge of a normal day/week/month.
±2σ ≈ 95%: a rare move.
±3σ ≈ 99.7%: the outer edge. Worth watching around earnings and big events.
• Optional: ±0.5σ, ±1.5σ and ±2.5σ midpoints, faded levels from previous periods, and the next session's levels drawn after the close.
• A reading line under the indicator list that describes the chart in plain words, for example "Quiet day: inside the normal range, 30% of the expected move used" or "Above +2σ: a rare move. Outer edge +3σ at …". English, Arabic, Spanish or Turkish.
• An optional dashboard (off by default) with the volatility used, the expected move in points and percent, where price sits in σ, how much of the ±1σ range the period has already covered, and the next session's range after the close.
HOW IT WORKS
σ = anchor × IV × √(days ÷ 252), with days = 1 (Daily), 5 (Weekly) or 21 (Monthly).
IV is the previous day's close of the volatility source:
• SPX / SPY: VIX1D for the Daily horizon, VIX for Weekly and Monthly.
• NDX / QQQ: VXN. RUT / IWM: RVX.
• Any other symbol: historical volatility (20 days by default), or a manual IV you type in.
Levels are fixed at the start of each period, so they never move or repaint during the session.
After the 16:00 New York close, the next session's range is computed from today's close and today's volatility close. VIX1D settles about 15 minutes after the close, so for a few minutes the dashboard may say it is waiting for it.
0DTE MODE (optional, off by default)
For same-day options on an intraday chart with the Daily horizon: a theta clock (share of today's time value left, √ of the session left), the move still priced in from now to the close (two dashed lines to 16:00) and how far a strike you enter is compared with that move. An alert fires when it is late: little time left, or the strike is beyond the move left.
HOW TO USE IT
1. Add it to an intraday chart (5 or 15 minutes works well) with the Daily horizon, or a daily chart with Weekly/Monthly.
2. Before the open, note the anchor, ±1σ and ±2σ. These are the day's reference prices.
3. During the session, read the line under the legend: inside the range, near the edge, stretched, rare or extreme.
4. Optional alerts: Touched ±0.5σ, ±1σ, ±2σ, and the 0DTE Late alert.
WHY IT IS DIFFERENT
It matches the volatility index to the horizon (VIX1D for one day instead of VIX for 30 days), anchors to the previous close so levels are stable, previews the next session as soon as the volatility index settles, and translates the chart into one plain sentence in four languages.
EXAMPLES

NVDA, 5 minutes, Daily horizon, previous 5 days kept. Each day gets its own levels from the previous close. 26 Oct: price pushed above +1σ and stalled just under +2σ. 27 Oct: the high stopped just under +1σ. 29 Oct: the low held just above −1σ.

GOOGL, 5 minutes. Four quiet days inside the range, then earnings: the stock opened far below −3σ. Volatility from past prices could not see the event coming (see Limitations).
LIMITATIONS
• σ levels describe a normal distribution. Real markets have fat tails: moves beyond ±2σ happen more often than 5% of the time.
• Historical volatility does not know about upcoming earnings or events. On single stocks around earnings, the real move is often much larger than these levels. For a move priced from the stock's own options, use an ATM straddle instead.
• The VIX family measures index options. On SPY/QQQ/IWM the levels follow the index's volatility, not the ETF's own option chain.
• Market holidays are not adjusted. Free TradingView data may be delayed.
• The reading line describes where price is. It is not a buy or sell signal.
Educational tool. Not financial advice.
بالعربي
يشتغل على أي رمز: أسهم، صناديق، مؤشرات، عقود، فوركس وكريبتو. يرسم النطاق اللي يسعّره سوق الأوبشن لليوم أو الأسبوع أو الشهر: الإغلاق السابق، و±1σ (اليوم الطبيعي)، و±2σ (حركة نادرة)، و±3σ (الحد الأقصى). ومعه سطر قراءة بكلام بسيط تحت قائمة المؤشرات، تقدر تخليه بالعربي من الإعدادات (Reading language). اللوحة مقفلة افتراضياً. الحساب مبني على VIX1D وأخواته أو التذبذب التاريخي، فما يعرف عن إعلانات الأرباح. أداة تعليمية، وليست نصيحة مالية.
WORKS ON
Any symbol: stocks, ETFs, indices, futures, forex and crypto. Index products (SPX/SPY, NDX/QQQ, RUT/IWM) use their own volatility index; everything else uses the symbol's historical volatility, or a manual IV.
WHAT IT DRAWS
• A dashed line at the anchor: the previous period's close (yesterday for Daily, last Friday for Weekly, last month's close for Monthly).
• Solid lines at ±1σ and ±2σ, and dotted lines at ±3σ.
±1σ ≈ 68% of periods stay inside: the edge of a normal day/week/month.
±2σ ≈ 95%: a rare move.
±3σ ≈ 99.7%: the outer edge. Worth watching around earnings and big events.
• Optional: ±0.5σ, ±1.5σ and ±2.5σ midpoints, faded levels from previous periods, and the next session's levels drawn after the close.
• A reading line under the indicator list that describes the chart in plain words, for example "Quiet day: inside the normal range, 30% of the expected move used" or "Above +2σ: a rare move. Outer edge +3σ at …". English, Arabic, Spanish or Turkish.
• An optional dashboard (off by default) with the volatility used, the expected move in points and percent, where price sits in σ, how much of the ±1σ range the period has already covered, and the next session's range after the close.
HOW IT WORKS
σ = anchor × IV × √(days ÷ 252), with days = 1 (Daily), 5 (Weekly) or 21 (Monthly).
IV is the previous day's close of the volatility source:
• SPX / SPY: VIX1D for the Daily horizon, VIX for Weekly and Monthly.
• NDX / QQQ: VXN. RUT / IWM: RVX.
• Any other symbol: historical volatility (20 days by default), or a manual IV you type in.
Levels are fixed at the start of each period, so they never move or repaint during the session.
After the 16:00 New York close, the next session's range is computed from today's close and today's volatility close. VIX1D settles about 15 minutes after the close, so for a few minutes the dashboard may say it is waiting for it.
0DTE MODE (optional, off by default)
For same-day options on an intraday chart with the Daily horizon: a theta clock (share of today's time value left, √ of the session left), the move still priced in from now to the close (two dashed lines to 16:00) and how far a strike you enter is compared with that move. An alert fires when it is late: little time left, or the strike is beyond the move left.
HOW TO USE IT
1. Add it to an intraday chart (5 or 15 minutes works well) with the Daily horizon, or a daily chart with Weekly/Monthly.
2. Before the open, note the anchor, ±1σ and ±2σ. These are the day's reference prices.
3. During the session, read the line under the legend: inside the range, near the edge, stretched, rare or extreme.
4. Optional alerts: Touched ±0.5σ, ±1σ, ±2σ, and the 0DTE Late alert.
WHY IT IS DIFFERENT
It matches the volatility index to the horizon (VIX1D for one day instead of VIX for 30 days), anchors to the previous close so levels are stable, previews the next session as soon as the volatility index settles, and translates the chart into one plain sentence in four languages.
EXAMPLES
NVDA, 5 minutes, Daily horizon, previous 5 days kept. Each day gets its own levels from the previous close. 26 Oct: price pushed above +1σ and stalled just under +2σ. 27 Oct: the high stopped just under +1σ. 29 Oct: the low held just above −1σ.
GOOGL, 5 minutes. Four quiet days inside the range, then earnings: the stock opened far below −3σ. Volatility from past prices could not see the event coming (see Limitations).
LIMITATIONS
• σ levels describe a normal distribution. Real markets have fat tails: moves beyond ±2σ happen more often than 5% of the time.
• Historical volatility does not know about upcoming earnings or events. On single stocks around earnings, the real move is often much larger than these levels. For a move priced from the stock's own options, use an ATM straddle instead.
• The VIX family measures index options. On SPY/QQQ/IWM the levels follow the index's volatility, not the ETF's own option chain.
• Market holidays are not adjusted. Free TradingView data may be delayed.
• The reading line describes where price is. It is not a buy or sell signal.
Educational tool. Not financial advice.
بالعربي
يشتغل على أي رمز: أسهم، صناديق، مؤشرات، عقود، فوركس وكريبتو. يرسم النطاق اللي يسعّره سوق الأوبشن لليوم أو الأسبوع أو الشهر: الإغلاق السابق، و±1σ (اليوم الطبيعي)، و±2σ (حركة نادرة)، و±3σ (الحد الأقصى). ومعه سطر قراءة بكلام بسيط تحت قائمة المؤشرات، تقدر تخليه بالعربي من الإعدادات (Reading language). اللوحة مقفلة افتراضياً. الحساب مبني على VIX1D وأخواته أو التذبذب التاريخي، فما يعرف عن إعلانات الأرباح. أداة تعليمية، وليست نصيحة مالية.

Disclaimer
The information and publications are not meant to be, and do not constitute, financial, investment, trading, or other types of advice or recommendations supplied or endorsed by TradingView. Read more in the Terms of Use.
Disclaimer
The information and publications are not meant to be, and do not constitute, financial, investment, trading, or other types of advice or recommendations supplied or endorsed by TradingView. Read more in the Terms of Use.