Golden Cross Cycles
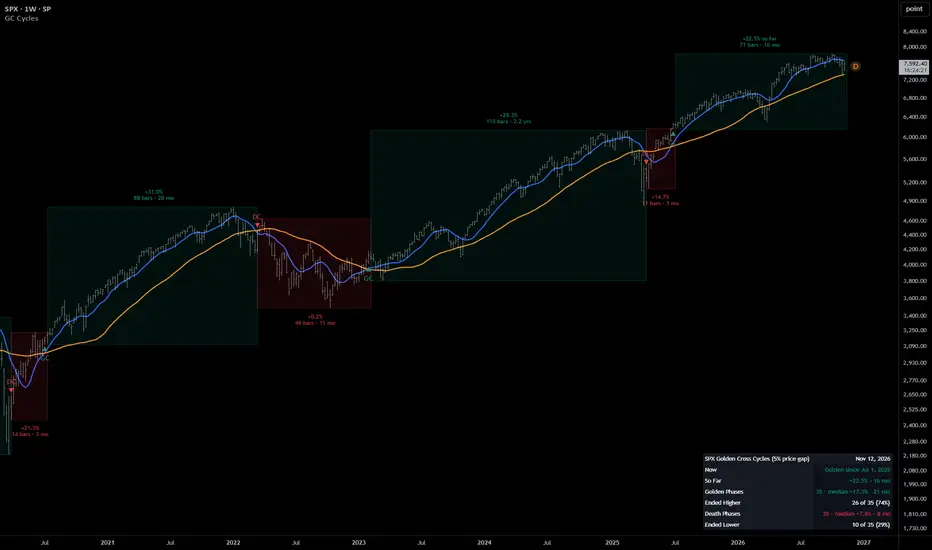
Golden Cross Cycles measures what happened between each golden cross and death cross of the 50-day and 200-day simple moving averages. It draws each phase from one phase start to the next with its change and length, and summarizes the completed phases in a table.
How It Works
The two averages are always computed on daily closes, so daily, weekly and monthly charts show the same lines and, except for a change that reverses inside one weekly or monthly bar, the same phases. A golden phase starts after a golden cross (the 50-day average crosses above the 200-day), on the first day the daily close is at least 5% above the 200-day average; most of the time that is the cross day itself. A death phase starts after a death cross, on the first day the close is at least 5% below the 200-day. Until then the current phase continues, so a small cross that reverses before price moves 5% away from the 200-day does not start a phase. Each phase is measured from the close on the day it starts to the close on the day the next one starts, so every number was known on the day the phase ended.
How to Read It
Settings
Testing
The price gap was chosen on ten markets (SPX, DJI, IXIC, QQQ, IWM, AAPL, MSFT, GLD, TLT, XLE), each from the start of its daily history, using daily closes. With no gap, 75 of 499 phases (15%) ended within 40 trading days; with the 5% gap, 10 of 350 (3%), and at least half of all phases still started on the cross day. These are hypothetical results on past data, not results of trading: they are calculated with hindsight.
Repainting
Cross markers, phase starts and completed phases do not repaint once a bar closes. On the live bar the averages move, so a cross or a phase start can appear and vanish until the bar closes. Set the alerts for crosses and phase starts to Once Per Bar Close; the "Any alert() function call" alert already waits for the close. The phase in progress updates with each bar.
Limitations
Originality
Moving-average crossovers are common. This script filters the crosses with a price gap, measures every completed phase from the day it was known, on daily averages for any timeframe, and shows the record with its count, so the cross can be judged on its history rather than on a single chart.
For education and research only. Not financial advice.
How It Works
The two averages are always computed on daily closes, so daily, weekly and monthly charts show the same lines and, except for a change that reverses inside one weekly or monthly bar, the same phases. A golden phase starts after a golden cross (the 50-day average crosses above the 200-day), on the first day the daily close is at least 5% above the 200-day average; most of the time that is the cross day itself. A death phase starts after a death cross, on the first day the close is at least 5% below the 200-day. Until then the current phase continues, so a small cross that reverses before price moves 5% away from the 200-day does not start a phase. Each phase is measured from the close on the day it starts to the close on the day the next one starts, so every number was known on the day the phase ended.
How to Read It
- Teal boxes are golden phases and red boxes are death phases. Each box spans the phase's high and low; its label shows the change, the number of bars and the calendar length.
- GC and DC mark the actual crosses. Each box starts on the day price confirms the cross, usually the same day; a cross that price never confirms keeps its marker but gets no box.
- The table shows the current phase with its start date and the change so far, then for each kind of phase how many completed, their median change and length, and how many ended in their own direction (golden higher, death lower).
Settings
- SMA Lengths: 50 and 200 by default, in days.
- Price Gap %: 5 by default; 0 starts a phase on every cross, on the cross day.
- Confirmed Bars Only: shows cross markers and starts a phase only after the bar closes.
Testing
The price gap was chosen on ten markets (SPX, DJI, IXIC, QQQ, IWM, AAPL, MSFT, GLD, TLT, XLE), each from the start of its daily history, using daily closes. With no gap, 75 of 499 phases (15%) ended within 40 trading days; with the 5% gap, 10 of 350 (3%), and at least half of all phases still started on the cross day. These are hypothetical results on past data, not results of trading: they are calculated with hindsight.
Repainting
Cross markers, phase starts and completed phases do not repaint once a bar closes. On the live bar the averages move, so a cross or a phase start can appear and vanish until the bar closes. Set the alerts for crosses and phase starts to Once Per Bar Close; the "Any alert() function call" alert already waits for the close. The phase in progress updates with each bar.
Limitations
- Moving averages lag price. Even with the price gap, a death phase often starts after most of a decline, and many end higher than they began.
- Supports daily, weekly and monthly charts only; the daily chart counts every phase change.
- The table counts only the history loaded on the chart, which depends on the symbol and your plan.
- Past phases do not predict future ones.
Originality
Moving-average crossovers are common. This script filters the crosses with a price gap, measures every completed phase from the day it was known, on daily averages for any timeframe, and shows the record with its count, so the cross can be judged on its history rather than on a single chart.
For education and research only. Not financial advice.

Disclaimer
The information and publications are not meant to be, and do not constitute, financial, investment, trading, or other types of advice or recommendations supplied or endorsed by TradingView. Read more in the Terms of Use.
Disclaimer
The information and publications are not meant to be, and do not constitute, financial, investment, trading, or other types of advice or recommendations supplied or endorsed by TradingView. Read more in the Terms of Use.