OPEN-SOURCE SCRIPT
SRJ India VIX Widget
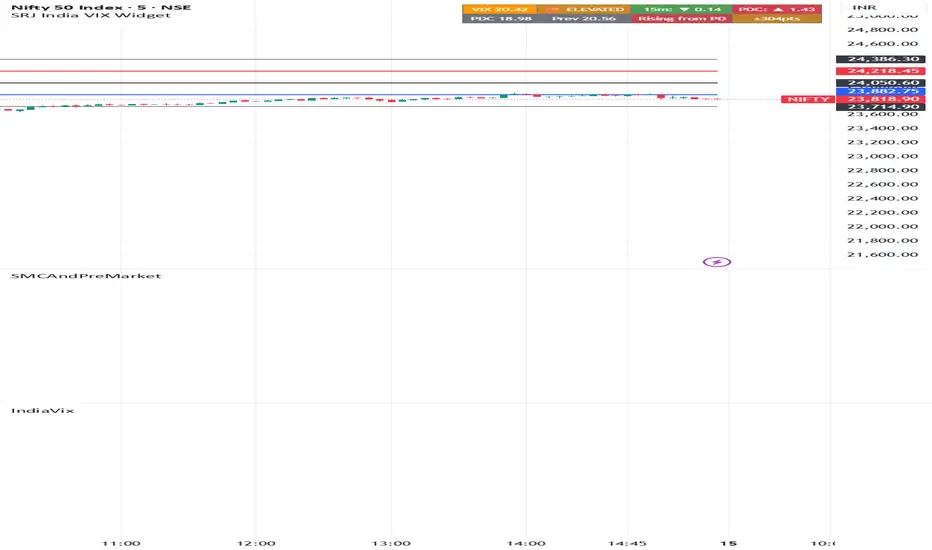
**SRJ India VIX Widget – Volatility Regime & Expected Range Tool**
The SRJ India VIX Widget combines real-time volatility regime tracking with a custom expected range model to support intraday planning and risk management for Indian index traders.
This indicator uses India VIX to estimate potential daily movement and plots volatility-adjusted levels around the previous day’s close. It also includes a live dashboard that tracks volatility shifts and short-term changes throughout the session.
**🔹 What it shows**
* Live VIX value with regime classification
* Change vs previous 15-minute interval and previous day close
* Volatility-based expected range levels
* Extended range bands for potential expansion scenarios
**🔹 How to use**
* Use the range bands as dynamic support and resistance zones
* Rising VIX indicates increasing volatility and possible trend expansion
* Falling VIX suggests compression and range-bound conditions
* Helps define intraday bias, targets, and risk levels
**🔹 Best suited for**
* Index intraday traders
* Volatility-based trading strategies
* Traders seeking objective, data-driven reference levels
**🔹Multi-use behavior**
On NSE indices: Displays both volatility dashboard and expected range levels
On other symbols (stocks, crypto, etc.): Works as a standalone India VIX dashboard for broader market context
**⚠️ Notes**
* Expected range levels are available only on supported NSE indices due to India VIX dependency
* These levels are statistical estimates and should not be treated as fixed support/resistance
**Disclaimer**
This script is an independent implementation combining volatility regime analysis with a custom expected range model.
The concept of volatility-based expected move estimation is widely used in financial markets; this indicator provides a structured adaptation with additional logic, visualization, and intraday context.
The SRJ India VIX Widget combines real-time volatility regime tracking with a custom expected range model to support intraday planning and risk management for Indian index traders.
This indicator uses India VIX to estimate potential daily movement and plots volatility-adjusted levels around the previous day’s close. It also includes a live dashboard that tracks volatility shifts and short-term changes throughout the session.
**🔹 What it shows**
* Live VIX value with regime classification
* Change vs previous 15-minute interval and previous day close
* Volatility-based expected range levels
* Extended range bands for potential expansion scenarios
**🔹 How to use**
* Use the range bands as dynamic support and resistance zones
* Rising VIX indicates increasing volatility and possible trend expansion
* Falling VIX suggests compression and range-bound conditions
* Helps define intraday bias, targets, and risk levels
**🔹 Best suited for**
* Index intraday traders
* Volatility-based trading strategies
* Traders seeking objective, data-driven reference levels
**🔹Multi-use behavior**
On NSE indices: Displays both volatility dashboard and expected range levels
On other symbols (stocks, crypto, etc.): Works as a standalone India VIX dashboard for broader market context
**⚠️ Notes**
* Expected range levels are available only on supported NSE indices due to India VIX dependency
* These levels are statistical estimates and should not be treated as fixed support/resistance
**Disclaimer**
This script is an independent implementation combining volatility regime analysis with a custom expected range model.
The concept of volatility-based expected move estimation is widely used in financial markets; this indicator provides a structured adaptation with additional logic, visualization, and intraday context.
Open-source script
In true TradingView spirit, the creator of this script has made it open-source, so that traders can review and verify its functionality. Kudos to the author! While you can use it for free, remember that republishing the code is subject to our House Rules.

Disclaimer
The information and publications are not meant to be, and do not constitute, financial, investment, trading, or other types of advice or recommendations supplied or endorsed by TradingView. Read more in the Terms of Use.
Open-source script
In true TradingView spirit, the creator of this script has made it open-source, so that traders can review and verify its functionality. Kudos to the author! While you can use it for free, remember that republishing the code is subject to our House Rules.
Disclaimer
The information and publications are not meant to be, and do not constitute, financial, investment, trading, or other types of advice or recommendations supplied or endorsed by TradingView. Read more in the Terms of Use.