Bollinger Squeeze Breakout: BBW + MFI Signals [forexobroker]
Bollinger Squeeze Breakout: BBW + MFI Signals [forexobroker]
🔶 OVERVIEW
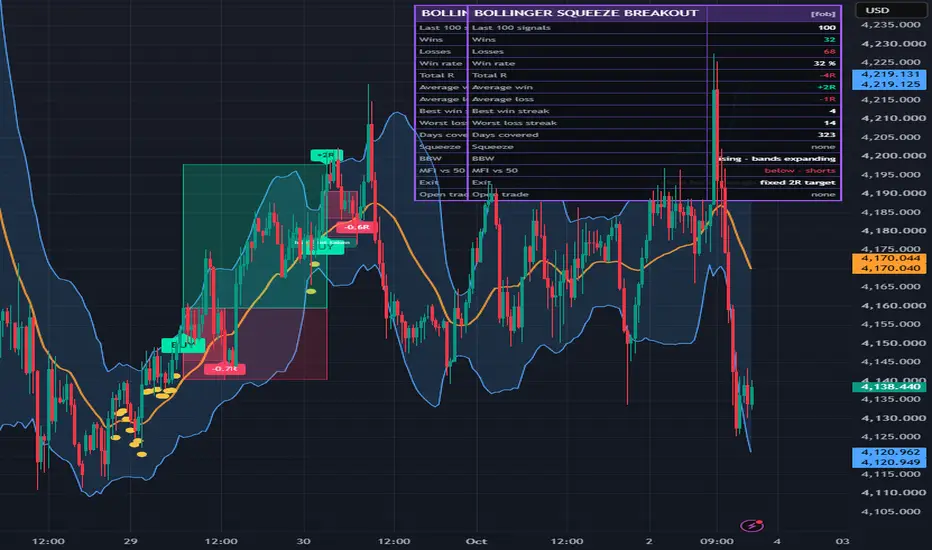
Bollinger Squeeze Breakout trades the Bollinger Bands squeeze on the breakout candle itself: a quiet market with a flat middle line and the bands pressed together, then the bands expanding again and a candle closing outside a band, confirmed by the Money Flow Index. Every trade runs until a candle closes back through the middle line, and the last 100 results are counted in a table on the chart.
It is built for traders who want to see, on their own symbol and timeframe, what the squeeze breakout really did over the last 100 trades, wins and losses alike, before they trust it. A switch turns the MFI condition off, and a second setting replaces the middle-line exit with a fixed target, so both choices can be measured on the same chart.
🔶 HOW IT WORKS
1. The range. The middle line (20 SMA) is relatively flat: it moved less than 1 ATR(14) over the last 10 candles. It does not have to be perfectly flat.
2. The squeeze. The bands are close together. The Bollinger BandWidth (BBW = (upper - lower) / middle × 100, the same formula and settings as TradingView's Bollinger BandWidth) is within 20 % of its lowest value of the last 125 candles. A candle that is both flat and squeezed is a squeeze candle and gets a small yellow dot.
3. The expansion. The BBW rises: higher than on the candle before.
4. The direction. A candle closes outside a band: above the upper band for a long, below the lower band for a short. The last squeeze candle must lie within the 20 candles before it; one signal per squeeze.
5. The confirmation (Money Flow Index 14, both levels at 50). The MFI above 50 for a long, below 50 for a short.
🔶 TRADE MANAGEMENT
Entry at the close of the breakout candle. Default exit: the trade runs until a candle closes back through the middle line (a long: the first close below it; a short: the first close above it) and closes at that candle's close. While a trade is open, the middle line is drawn brighter, because it is the exit.
There is no fixed stop in this exit, so the risk unit R is the distance from the entry close to the middle line at entry. A trade that comes straight back ends near -1R; a move that keeps running ends at many R. The trade is drawn as a dashed red box (the 1R risk) and a box from the entry to the exit, green or red, with the result in R at the exit candle ("+3.4R", "-0.9R").
Optional "Fixed target" exit: the stop at the middle line at entry, the target at a reward multiple of that risk (2R by default). The stop is checked first when one candle touches both.
🔶 THE LOG
One trade at a time. A valid breakout that appears while a trade is still open is drawn faded and is not counted (switch "Allow overlapping trades" on to count every breakout). Every open trade is followed on closed candles to its exit.
The last N results (100 by default) feed the table: signals, wins, losses, win rate, total R, average win, average loss, best win streak, worst loss streak and days covered, followed by the live state: squeeze, BBW rising or falling, MFI side, the exit in use and the open trade.
NON-REPAINTING: every condition, every signal and every result is evaluated on barstate.isconfirmed; a breakout only looks at squeeze candles that closed before it; there is no request.security and no lookahead.
🔶 SETTINGS
Bollinger Bands
- Length (20) and standard deviations (2), TradingView's defaults.
Squeeze
- Squeeze: BBW within % of its low (20), Lowest BBW lookback (125 candles).
- Flat middle line: max move (1.0 × ATR) over (10 candles).
- Breakout within (20 candles after the squeeze).
Confirmation
- Require the MFI (default on), MFI length (14), MFI level (50).
- Allow overlapping trades (default off): one trade at a time.
- Take longs, Take shorts.
Exit
- Exit: Middle line (default) or Fixed target.
- Fixed target: reward ratio (default 2.0).
- Extend open trade boxes (bars).
Log
- Log size (default 100), Show log table, Table position, Table text size.
Visual
- Long, short, band, middle line and squeeze dot colours; show the bands; mark squeeze candles; BUY / SELL labels; +R / -R result labels; trades kept on chart; box fill transparency.
Alerts
- Send JSON alert() messages.
🔶 ALERTS
Four alertcondition hooks: BSB Long entry, BSB Short entry, BSB Any entry, BSB Exit. With "Send JSON alert() messages" on, every taken entry and every exit also fires an alert() once per bar close with a JSON body (action, ticker, timeframe, entry and the middle line; for an exit the side, the exit price and the result in R).
🔶 LIMITATIONS
- A squeeze says that a move is likely, not which way it goes. Many breakouts fall straight back through the middle line; the log's win rate and worst loss streak show how often that happened on your symbol.
- The middle-line exit cuts the losses near 1R and lets the winners run, so the strategy lives on a few large wins. Look at the average win against the average loss, not only at the win rate.
- The MFI needs volume. On symbols without volume data the table shows "no volume data" and no trade is taken while the MFI is required; switch "Require the MFI" off there.
- Results in the log are the script's own rules applied to closed candles: no spread, no commission, no slippage.
- This is an analysis tool, not financial advice, and past performance does not guarantee future results. Test on your own market and timeframe before relying on any signal.
🔶 OVERVIEW
Bollinger Squeeze Breakout trades the Bollinger Bands squeeze on the breakout candle itself: a quiet market with a flat middle line and the bands pressed together, then the bands expanding again and a candle closing outside a band, confirmed by the Money Flow Index. Every trade runs until a candle closes back through the middle line, and the last 100 results are counted in a table on the chart.
It is built for traders who want to see, on their own symbol and timeframe, what the squeeze breakout really did over the last 100 trades, wins and losses alike, before they trust it. A switch turns the MFI condition off, and a second setting replaces the middle-line exit with a fixed target, so both choices can be measured on the same chart.
🔶 HOW IT WORKS
1. The range. The middle line (20 SMA) is relatively flat: it moved less than 1 ATR(14) over the last 10 candles. It does not have to be perfectly flat.
2. The squeeze. The bands are close together. The Bollinger BandWidth (BBW = (upper - lower) / middle × 100, the same formula and settings as TradingView's Bollinger BandWidth) is within 20 % of its lowest value of the last 125 candles. A candle that is both flat and squeezed is a squeeze candle and gets a small yellow dot.
3. The expansion. The BBW rises: higher than on the candle before.
4. The direction. A candle closes outside a band: above the upper band for a long, below the lower band for a short. The last squeeze candle must lie within the 20 candles before it; one signal per squeeze.
5. The confirmation (Money Flow Index 14, both levels at 50). The MFI above 50 for a long, below 50 for a short.
🔶 TRADE MANAGEMENT
Entry at the close of the breakout candle. Default exit: the trade runs until a candle closes back through the middle line (a long: the first close below it; a short: the first close above it) and closes at that candle's close. While a trade is open, the middle line is drawn brighter, because it is the exit.
There is no fixed stop in this exit, so the risk unit R is the distance from the entry close to the middle line at entry. A trade that comes straight back ends near -1R; a move that keeps running ends at many R. The trade is drawn as a dashed red box (the 1R risk) and a box from the entry to the exit, green or red, with the result in R at the exit candle ("+3.4R", "-0.9R").
Optional "Fixed target" exit: the stop at the middle line at entry, the target at a reward multiple of that risk (2R by default). The stop is checked first when one candle touches both.
🔶 THE LOG
One trade at a time. A valid breakout that appears while a trade is still open is drawn faded and is not counted (switch "Allow overlapping trades" on to count every breakout). Every open trade is followed on closed candles to its exit.
The last N results (100 by default) feed the table: signals, wins, losses, win rate, total R, average win, average loss, best win streak, worst loss streak and days covered, followed by the live state: squeeze, BBW rising or falling, MFI side, the exit in use and the open trade.
NON-REPAINTING: every condition, every signal and every result is evaluated on barstate.isconfirmed; a breakout only looks at squeeze candles that closed before it; there is no request.security and no lookahead.
🔶 SETTINGS
Bollinger Bands
- Length (20) and standard deviations (2), TradingView's defaults.
Squeeze
- Squeeze: BBW within % of its low (20), Lowest BBW lookback (125 candles).
- Flat middle line: max move (1.0 × ATR) over (10 candles).
- Breakout within (20 candles after the squeeze).
Confirmation
- Require the MFI (default on), MFI length (14), MFI level (50).
- Allow overlapping trades (default off): one trade at a time.
- Take longs, Take shorts.
Exit
- Exit: Middle line (default) or Fixed target.
- Fixed target: reward ratio (default 2.0).
- Extend open trade boxes (bars).
Log
- Log size (default 100), Show log table, Table position, Table text size.
Visual
- Long, short, band, middle line and squeeze dot colours; show the bands; mark squeeze candles; BUY / SELL labels; +R / -R result labels; trades kept on chart; box fill transparency.
Alerts
- Send JSON alert() messages.
🔶 ALERTS
Four alertcondition hooks: BSB Long entry, BSB Short entry, BSB Any entry, BSB Exit. With "Send JSON alert() messages" on, every taken entry and every exit also fires an alert() once per bar close with a JSON body (action, ticker, timeframe, entry and the middle line; for an exit the side, the exit price and the result in R).
🔶 LIMITATIONS
- A squeeze says that a move is likely, not which way it goes. Many breakouts fall straight back through the middle line; the log's win rate and worst loss streak show how often that happened on your symbol.
- The middle-line exit cuts the losses near 1R and lets the winners run, so the strategy lives on a few large wins. Look at the average win against the average loss, not only at the win rate.
- The MFI needs volume. On symbols without volume data the table shows "no volume data" and no trade is taken while the MFI is required; switch "Require the MFI" off there.
- Results in the log are the script's own rules applied to closed candles: no spread, no commission, no slippage.
- This is an analysis tool, not financial advice, and past performance does not guarantee future results. Test on your own market and timeframe before relying on any signal.

🔵Gain access to our powerful tools : kestutisbalciunas.com/tradingview/
🔵Join our free telegram for updates : t.me/algotradingedge
All scripts & content provided by Forexobroker are for informational & educational purposes only.
🔵Join our free telegram for updates : t.me/algotradingedge
All scripts & content provided by Forexobroker are for informational & educational purposes only.
Disclaimer
The information and publications are not meant to be, and do not constitute, financial, investment, trading, or other types of advice or recommendations supplied or endorsed by TradingView. Read more in the Terms of Use.
🔵Gain access to our powerful tools : kestutisbalciunas.com/tradingview/
🔵Join our free telegram for updates : t.me/algotradingedge
All scripts & content provided by Forexobroker are for informational & educational purposes only.
🔵Join our free telegram for updates : t.me/algotradingedge
All scripts & content provided by Forexobroker are for informational & educational purposes only.
Disclaimer
The information and publications are not meant to be, and do not constitute, financial, investment, trading, or other types of advice or recommendations supplied or endorsed by TradingView. Read more in the Terms of Use.