OPEN-SOURCE SCRIPT
Volume Whale Zones [ChartPrime]
🔶 OVERVIEW
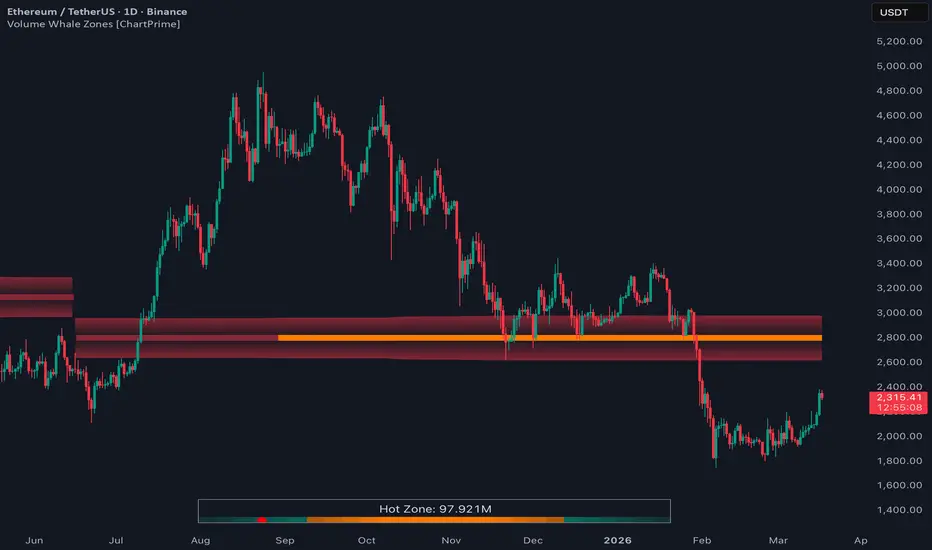
Volume Whale Zones [ChartPrime] is a dynamic structural volume engine designed to detect and stabilize the most actively traded price region inside a rolling range.
Instead of plotting a traditional static Volume Profile, this indicator builds a state-based, volatility-adjusted Point of Control (PoC) model that evolves only when true structural expansion occurs.
The result is a highly stable institutional-grade “Hot Zone” — a price area where market participation is most concentrated.
🔶 CORE PHILOSOPHY

Most volume tools react instantly to small fluctuations.
Volume Whale Zones [ChartPrime] does not.
It is built on three core principles:
This prevents noise and highlights meaningful accumulation or distribution zones.
🔶 RANGE ENGINE
The indicator continuously tracks:
The Hot Zone only recalculates aggressively when:
• A new structural high forms
• Or a new structural low forms
If the range does not expand, the zone remains stable.
This avoids over-reactive behavior during sideways movement.
🔶 VOLUME PROFILE CORE
Inside the defined range:
Unlike traditional Volume Profile:
• This profile recalculates continuously
• But structural filtering prevents instability
🔶 THREE-LAYER HOT ZONE STABILIZATION ENGINE
This is the most important part of the model.
The Hot Zone is built in three stages:
Level 0 – Structural Base
Level 1 – Refined Zone
Level 2 – Final Stable Zone

The final output is a multi-stage stabilized participation level.
🔶 VOLATILITY CLAMPING
To prevent distortion during extreme moves:
This produces institutional-style smoothing behavior.
🔶 VISUAL STRUCTURE

The zone only visually reacts when real structural change occurs.
🔶 HOT ZONE DEVIATION OSCILLATOR
The indicator includes a built-in deviation measurement:
This gives traders immediate context:
• Is price stretched above value?
• Is price compressed below value?
• Is price sitting directly at the participation core?


🔶 LOOKBACK ORANGE HOT ZONE (CONTEXT OVERLAY)
The indicator plots two visual “Hot Zone” layers:
1) Main Hot Zone (Stable Structural Line)
2) Lookback Hot Zone (Orange Window Line)

So visually you get:
• Long-term stable zone (main)
• Short-term contextual zone (orange lookback window)
🔶 WHAT THE HOT ZONE REPRESENTS
The Hot Zone acts as:
Price often:
• Reacts around it
• Consolidates near it
• Expands away from it
• Returns to it after extremes
🔶 HOW TO USE
Best suited for:
• Range traders
• Intraday scalpers
• Swing continuation traders
• Liquidity-based strategies
🔶 DIFFERENCE FROM TRADITIONAL POC
Traditional PoC:
• Recalculates every bar
• Flickers frequently
• Is highly reactive
Volume Whale Zones [ChartPrime]:
• State-based
• Volatility-filtered
• Multi-layer stabilized
• Structure-aware
This produces far cleaner institutional behavior.
🔶 CONCLUSION
Volume Whale Zones [ChartPrime] transforms raw volume data into a stabilized structural participation model.
By combining:
• Rolling range detection
• Dynamic volume profiling
• ATR-based clamping
• Multi-stage stabilization
• Deviation analytics
It delivers a powerful value engine that reveals where the market is truly active — and where price is statistically stretched.
This is not just a PoC.
It is a volatility-aware institutional participation zone.
Volume Whale Zones [ChartPrime] is a dynamic structural volume engine designed to detect and stabilize the most actively traded price region inside a rolling range.
Instead of plotting a traditional static Volume Profile, this indicator builds a state-based, volatility-adjusted Point of Control (PoC) model that evolves only when true structural expansion occurs.
The result is a highly stable institutional-grade “Hot Zone” — a price area where market participation is most concentrated.
🔶 CORE PHILOSOPHY
Most volume tools react instantly to small fluctuations.
Volume Whale Zones [ChartPrime] does not.
It is built on three core principles:
- Structural range expansion matters more than small fluctuations.
- Volume concentration must be volatility-adjusted.
- Stability requires state logic, not raw recalculation.
This prevents noise and highlights meaningful accumulation or distribution zones.
🔶 RANGE ENGINE
The indicator continuously tracks:
- Highest high over the lookback window.
- Lowest low over the lookback window.
- Whether the range has structurally expanded.
The Hot Zone only recalculates aggressively when:
• A new structural high forms
• Or a new structural low forms
If the range does not expand, the zone remains stable.
This avoids over-reactive behavior during sideways movement.
🔶 VOLUME PROFILE CORE
Inside the defined range:
- The range is divided into 50 price rows.
- Volume is accumulated per price bin.
- The highest volume bin becomes the raw PoC.
Unlike traditional Volume Profile:
• This profile recalculates continuously
• But structural filtering prevents instability
🔶 THREE-LAYER HOT ZONE STABILIZATION ENGINE
This is the most important part of the model.
The Hot Zone is built in three stages:
Level 0 – Structural Base
- Raw PoC is detected.
- Movement is volatility-clamped using ATR.
- Sudden jumps are limited to ATR × 2.
- EMA smoothing is applied.
Level 1 – Refined Zone
- Only updates if price displacement exceeds ATR threshold.
- Filters minor structural shifts.
- Acts as a mid-level stabilizer.
Level 2 – Final Stable Zone
- Only updates if Level 1 exceeds another ATR band.
- Creates long-term stability.
- Prevents rapid zone flickering.
The final output is a multi-stage stabilized participation level.
🔶 VOLATILITY CLAMPING
To prevent distortion during extreme moves:
- PoC movement is limited using ATR × 2.
- Outlier jumps are capped.
- Sudden spikes cannot instantly shift the Hot Zone.
This produces institutional-style smoothing behavior.
🔶 VISUAL STRUCTURE
- Thick central line → Final Hot Zone.
- Optional wide shaded zone above and below.
- Stepline structure highlights state shifts.
- Color transparency increases when structure changes.
The zone only visually reacts when real structural change occurs.
🔶 HOT ZONE DEVIATION OSCILLATOR
The indicator includes a built-in deviation measurement:
- Deviation = (Close − Hot Zone) / ATR.
- Values are clamped between -4 and +4.
- Displayed as a centered horizontal oscillator table.
- Active cell marks current price displacement.
This gives traders immediate context:
• Is price stretched above value?
• Is price compressed below value?
• Is price sitting directly at the participation core?
🔶 LOOKBACK ORANGE HOT ZONE (CONTEXT OVERLAY)
The indicator plots two visual “Hot Zone” layers:
1) Main Hot Zone (Stable Structural Line)
- The thick red Hot Zone line is the fully stabilized output (Level 2).
- It persists across history and only shifts when structural + ATR conditions are met.
2) Lookback Hot Zone (Orange Window Line)
- The orange line is the same Hot Zone level, but displayed only for the last Lookback bars.
- This gives traders a clean “recent context” view without long historical clutter.
- It helps compare where the zone currently sits versus older structural states.
So visually you get:
• Long-term stable zone (main)
• Short-term contextual zone (orange lookback window)
🔶 WHAT THE HOT ZONE REPRESENTS
The Hot Zone acts as:
- Institutional equilibrium area.
- Participation gravity center.
- Accumulation/distribution magnet.
- Reversion anchor during mean cycles.
Price often:
• Reacts around it
• Consolidates near it
• Expands away from it
• Returns to it after extremes
🔶 HOW TO USE
- Use the Hot Zone as a value anchor.
- Trade mean reversion when deviation is extreme.
- Look for breakouts when price compresses tightly around the zone.
- Combine with structure tools or liquidity sweeps.
- Use deviation to filter overextended moves.
Best suited for:
• Range traders
• Intraday scalpers
• Swing continuation traders
• Liquidity-based strategies
🔶 DIFFERENCE FROM TRADITIONAL POC
Traditional PoC:
• Recalculates every bar
• Flickers frequently
• Is highly reactive
Volume Whale Zones [ChartPrime]:
• State-based
• Volatility-filtered
• Multi-layer stabilized
• Structure-aware
This produces far cleaner institutional behavior.
🔶 CONCLUSION
Volume Whale Zones [ChartPrime] transforms raw volume data into a stabilized structural participation model.
By combining:
• Rolling range detection
• Dynamic volume profiling
• ATR-based clamping
• Multi-stage stabilization
• Deviation analytics
It delivers a powerful value engine that reveals where the market is truly active — and where price is statistically stretched.
This is not just a PoC.
It is a volatility-aware institutional participation zone.
Open-source script
In true TradingView spirit, the creator of this script has made it open-source, so that traders can review and verify its functionality. Kudos to the author! While you can use it for free, remember that republishing the code is subject to our House Rules.

Disclaimer
The information and publications are not meant to be, and do not constitute, financial, investment, trading, or other types of advice or recommendations supplied or endorsed by TradingView. Read more in the Terms of Use.
Open-source script
In true TradingView spirit, the creator of this script has made it open-source, so that traders can review and verify its functionality. Kudos to the author! While you can use it for free, remember that republishing the code is subject to our House Rules.
Disclaimer
The information and publications are not meant to be, and do not constitute, financial, investment, trading, or other types of advice or recommendations supplied or endorsed by TradingView. Read more in the Terms of Use.