Updated
Weighted Extreme
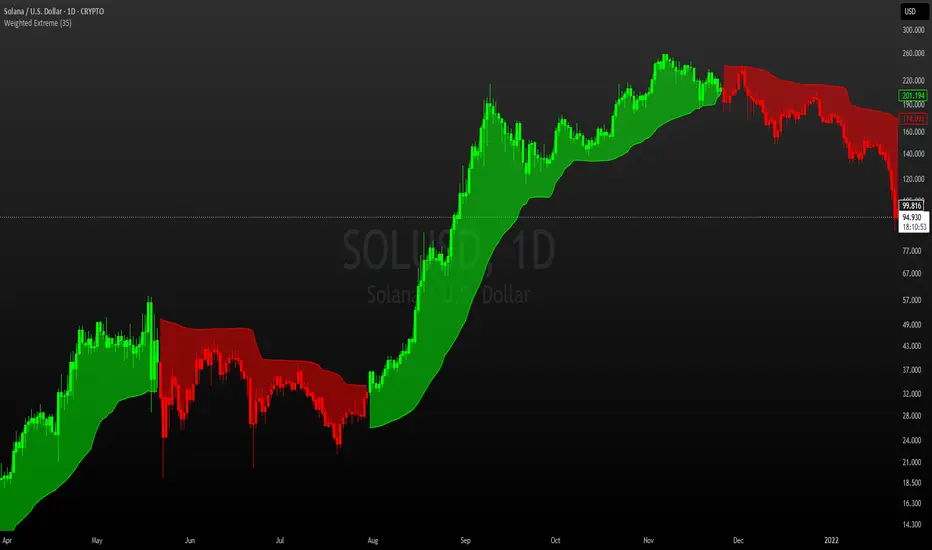
Weighted Extreme | MisinkoMaster
The Weighted Extreme indicator constructs a dynamic, volatility-based channel designed to capture aggressive price breakouts and structural momentum extremes. Classical channel indicators often rely purely on moving averages or static standard deviations, which can lag behind rapid market expansion. By blending a Weighted Moving Average (WMA) with absolute price extremes—pairing WMA with the highest high for the upper boundary and the lowest low for the lower boundary—Weighted Extreme creates responsive threshold bands that track the outer edges of active price action.
How It Works (The Core Architecture)
Hybrid Extreme Channel Construction
Upper Boundary: Calculates the midpoint between the weighted moving average and the highest high over the lookback period: upper = (ta.wma(close, len) + ta.highest(high, len)) / 2.
Lower Boundary: Calculates the midpoint between the weighted moving average and the lowest low over the lookback period: lower = (ta.wma(close, len) + ta.lowest(low, len)) / 2.
Breakout-Driven Trend Logic
Bullish State (1): Triggered when price closes above the upper extreme threshold (close > upper).
Bearish State (-1): Triggered when price closes below the lower extreme threshold (close < lower).
Key Features
Extreme Boundary Channels: Maps upper and lower threshold lines directly on your chart using historical price extremes blended with smoothed moving averages.
Dynamic Region Fills: Features colored background shading extending from the active channel lines to the close price, highlighting breakout intensity.
Conditional Line Breaks: Utilizes line break styling (plot.style_linebr) so channel plots appear only when active within their respective trend regimes.
On-Chart Candle Morphing: Automatically recolors main price chart candles (vibrant green for bullish breakouts, vivid red for bearish breakdowns, and dark gray when neutral).
Input Parameters & Optimization Guide
Lookback: Sets the evaluation window for calculating the weighted moving average, highest highs, and lowest lows (Default: 35).
Trading Strategies & Execution
Extreme Breakout Entries
Bullish Execution: Confirmed when price breaks and closes above the upper weighted extreme channel boundary, flipping price chart candles green.
Bearish Execution: Confirmed when price breaks and closes below the lower weighted extreme channel boundary, flipping price chart candles red.
Trend Continuation Tracking
During strong, uninterrupted momentum phases, price tends to ride along the outer boundary lines. Use the filled channel zones to monitor trend velocity and continuation strength.
Disclaimer: Trading financial markets involves high risk. This technical script is designed as an informational analytical tool to support your rule-based mechanical execution system and does not constitute financial advice.
The Weighted Extreme indicator constructs a dynamic, volatility-based channel designed to capture aggressive price breakouts and structural momentum extremes. Classical channel indicators often rely purely on moving averages or static standard deviations, which can lag behind rapid market expansion. By blending a Weighted Moving Average (WMA) with absolute price extremes—pairing WMA with the highest high for the upper boundary and the lowest low for the lower boundary—Weighted Extreme creates responsive threshold bands that track the outer edges of active price action.
How It Works (The Core Architecture)
Hybrid Extreme Channel Construction
Upper Boundary: Calculates the midpoint between the weighted moving average and the highest high over the lookback period: upper = (ta.wma(close, len) + ta.highest(high, len)) / 2.
Lower Boundary: Calculates the midpoint between the weighted moving average and the lowest low over the lookback period: lower = (ta.wma(close, len) + ta.lowest(low, len)) / 2.
Breakout-Driven Trend Logic
Bullish State (1): Triggered when price closes above the upper extreme threshold (close > upper).
Bearish State (-1): Triggered when price closes below the lower extreme threshold (close < lower).
Key Features
Extreme Boundary Channels: Maps upper and lower threshold lines directly on your chart using historical price extremes blended with smoothed moving averages.
Dynamic Region Fills: Features colored background shading extending from the active channel lines to the close price, highlighting breakout intensity.
Conditional Line Breaks: Utilizes line break styling (plot.style_linebr) so channel plots appear only when active within their respective trend regimes.
On-Chart Candle Morphing: Automatically recolors main price chart candles (vibrant green for bullish breakouts, vivid red for bearish breakdowns, and dark gray when neutral).
Input Parameters & Optimization Guide
Lookback: Sets the evaluation window for calculating the weighted moving average, highest highs, and lowest lows (Default: 35).
Trading Strategies & Execution
Extreme Breakout Entries
Bullish Execution: Confirmed when price breaks and closes above the upper weighted extreme channel boundary, flipping price chart candles green.
Bearish Execution: Confirmed when price breaks and closes below the lower weighted extreme channel boundary, flipping price chart candles red.
Trend Continuation Tracking
During strong, uninterrupted momentum phases, price tends to ride along the outer boundary lines. Use the filled channel zones to monitor trend velocity and continuation strength.
Disclaimer: Trading financial markets involves high risk. This technical script is designed as an informational analytical tool to support your rule-based mechanical execution system and does not constitute financial advice.
Release Notes
Updated plotting
"Better to take a step back, than to stand stuck forever."
Disclaimer
The information and publications are not meant to be, and do not constitute, financial, investment, trading, or other types of advice or recommendations supplied or endorsed by TradingView. Read more in the Terms of Use.
"Better to take a step back, than to stand stuck forever."
Disclaimer
The information and publications are not meant to be, and do not constitute, financial, investment, trading, or other types of advice or recommendations supplied or endorsed by TradingView. Read more in the Terms of Use.