Unhyped RSI
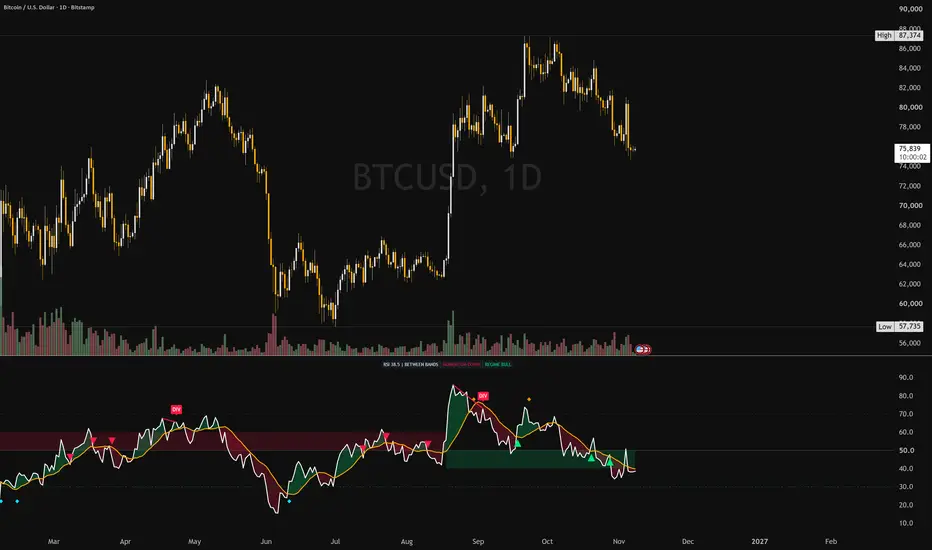
Unhyped RSI is a standard RSI(14) with a signal line, read through the market regime. The idea is simple: RSI behaves differently in bull and bear markets, so the levels that matter should change with the regime.
REGIME BANDS
The regime comes from a 200-period SMA (optionally on a higher timeframe, read from the last confirmed bar so it does not repaint).
• Bull regime: the 40–50 band is shaded. In uptrends RSI pullbacks often hold this zone.
• Bear regime: the 50–60 band is shaded. In downtrends RSI rallies often stall here.
WHAT THE MARKERS MEAN
• Triangles (band test): RSI tested the regime band within the last few bars, then crossed back over its signal line with enough slope, and the candle confirmed (close in the direction, or a strong wick). A cooldown stops repeated marks in the same direction.
• Diamonds: RSI reclaims 30 or loses 70, a sign that an extreme is fading.
• DIV / H-DIV labels: classic and hidden divergences between price pivots and RSI pivots. They are confirmed a set number of bars after the pivot, by construction, and do not move after they print.
• Status bar: regime, RSI value and momentum at a glance.
ALERTS
Alert conditions are included for band tests, 30/70 reclaims and divergences, so you can be told when something worth looking at happens instead of watching the chart.
HOW I USE IT
In my checklist this is a Trigger tool (step 4): it helps judge whether price is showing its hand at a level I already marked. It never replaces Regime, Location or a defined invalidation, and a marker is not a buy or sell call.
INPUTS
RSI and signal line length and type; regime SMA length and timeframe; candle confirmation, band look-back, minimum RSI slope, cooldowns; divergence pivot look-back and minimum difference; every display element can be switched off.
LIMITS
All oscillator signals fail regularly, especially in strong trends and thin markets. Test the settings on your own markets and timeframes before relying on them.
Education only, not financial advice. Crypto-assets are high-risk.
REGIME BANDS
The regime comes from a 200-period SMA (optionally on a higher timeframe, read from the last confirmed bar so it does not repaint).
• Bull regime: the 40–50 band is shaded. In uptrends RSI pullbacks often hold this zone.
• Bear regime: the 50–60 band is shaded. In downtrends RSI rallies often stall here.
WHAT THE MARKERS MEAN
• Triangles (band test): RSI tested the regime band within the last few bars, then crossed back over its signal line with enough slope, and the candle confirmed (close in the direction, or a strong wick). A cooldown stops repeated marks in the same direction.
• Diamonds: RSI reclaims 30 or loses 70, a sign that an extreme is fading.
• DIV / H-DIV labels: classic and hidden divergences between price pivots and RSI pivots. They are confirmed a set number of bars after the pivot, by construction, and do not move after they print.
• Status bar: regime, RSI value and momentum at a glance.
ALERTS
Alert conditions are included for band tests, 30/70 reclaims and divergences, so you can be told when something worth looking at happens instead of watching the chart.
HOW I USE IT
In my checklist this is a Trigger tool (step 4): it helps judge whether price is showing its hand at a level I already marked. It never replaces Regime, Location or a defined invalidation, and a marker is not a buy or sell call.
INPUTS
RSI and signal line length and type; regime SMA length and timeframe; candle confirmation, band look-back, minimum RSI slope, cooldowns; divergence pivot look-back and minimum difference; every display element can be switched off.
LIMITS
All oscillator signals fail regularly, especially in strong trends and thin markets. Test the settings on your own markets and timeframes before relying on them.
Education only, not financial advice. Crypto-assets are high-risk.

Disclaimer
The information and publications are not meant to be, and do not constitute, financial, investment, trading, or other types of advice or recommendations supplied or endorsed by TradingView. Read more in the Terms of Use.
Disclaimer
The information and publications are not meant to be, and do not constitute, financial, investment, trading, or other types of advice or recommendations supplied or endorsed by TradingView. Read more in the Terms of Use.