Updated
HTF Candle Box [rare_gold_steak]
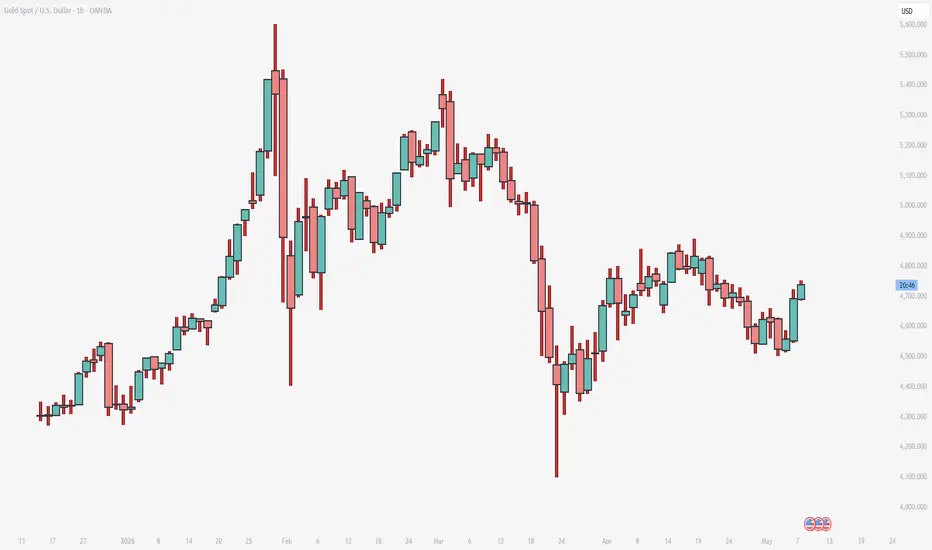
See the bigger picture
This indicator will overlay higher timeframe candles directly on your chart, so you can see the structure far more clearly. Whether you're on 1H showing 1D candles, or on 1D showing Weekly candles, it will make price easier to read at a glance
Plots the box as a normal candle would:
Everything is customizable. Enjoy
This indicator will overlay higher timeframe candles directly on your chart, so you can see the structure far more clearly. Whether you're on 1H showing 1D candles, or on 1D showing Weekly candles, it will make price easier to read at a glance
Plots the box as a normal candle would:
- Open — where price started the day
- Close — where price ended the day
- High — highest point reached
- Low — lowest point reached
Everything is customizable. Enjoy
Release Notes
Updated to show GREEN/RED candles on default. Can be turned off in the settings.
Disclaimer
The information and publications are not meant to be, and do not constitute, financial, investment, trading, or other types of advice or recommendations supplied or endorsed by TradingView. Read more in the Terms of Use.
Disclaimer
The information and publications are not meant to be, and do not constitute, financial, investment, trading, or other types of advice or recommendations supplied or endorsed by TradingView. Read more in the Terms of Use.