OPEN-SOURCE SCRIPT
RTH Previous Day Levels | VAH VAL POC PDH PDL
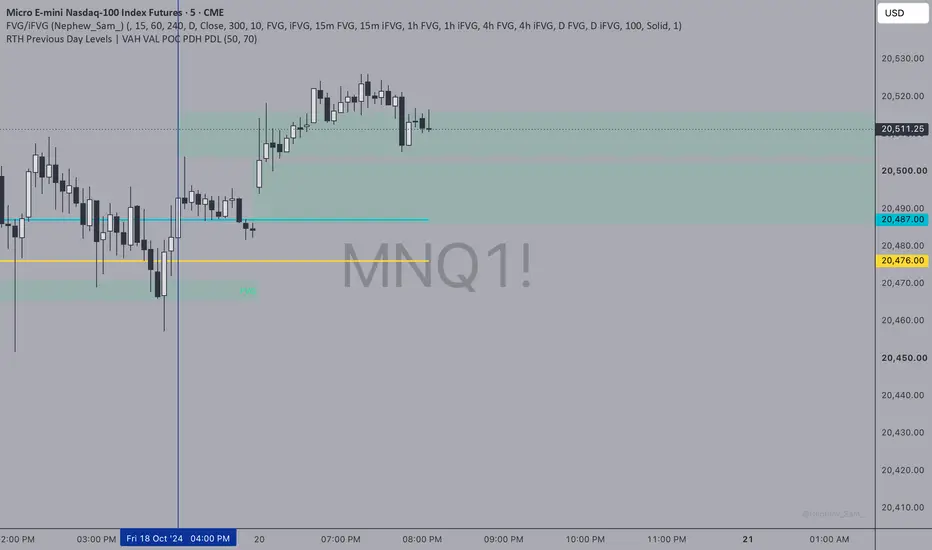
# Previous Day RTH Levels | VAH, VAL, POC, PDH & PDL
This indicator automatically plots five key price levels from the previous trading day's Regular Trading Hours (RTH) session, helping traders identify important areas of support, resistance, liquidity, and potential price acceptance or rejection.
Designed primarily for Nasdaq futures (NQ/MNQ), the indicator uses the New York RTH session (9:30 AM–4:00 PM ET).
### Key Features
- **PDH (Previous Day High):** The highest price reached during the previous RTH session.
- **PDL (Previous Day Low):** The lowest price reached during the previous RTH session.
- **VAH (Value Area High):** The upper boundary of the calculated value area.
- **VAL (Value Area Low):** The lower boundary of the calculated value area.
- **POC (Point of Control):** The price level with the highest estimated trading volume.
### Customization
- Individually enable or disable all five levels.
- Adjust volume profile resolution.
- Customize the value area percentage (70% default).
- Automatically updates levels for each new trading session.
### Trading Applications
Useful for identifying liquidity sweeps, breakouts, reversals, support and resistance, and price acceptance or rejection around previous-session levels.
### Important Notes
Volume profile levels are calculated using an estimated distribution of candle volume across price ranges. Results may differ from TradingView's built-in Volume Profile tools.
Designed for intraday charts, particularly the 5-minute timeframe.
**Disclaimer:** This indicator is intended for educational and technical analysis purposes only. It does not generate buy or sell signals and should not be considered financial advice.
This indicator automatically plots five key price levels from the previous trading day's Regular Trading Hours (RTH) session, helping traders identify important areas of support, resistance, liquidity, and potential price acceptance or rejection.
Designed primarily for Nasdaq futures (NQ/MNQ), the indicator uses the New York RTH session (9:30 AM–4:00 PM ET).
### Key Features
- **PDH (Previous Day High):** The highest price reached during the previous RTH session.
- **PDL (Previous Day Low):** The lowest price reached during the previous RTH session.
- **VAH (Value Area High):** The upper boundary of the calculated value area.
- **VAL (Value Area Low):** The lower boundary of the calculated value area.
- **POC (Point of Control):** The price level with the highest estimated trading volume.
### Customization
- Individually enable or disable all five levels.
- Adjust volume profile resolution.
- Customize the value area percentage (70% default).
- Automatically updates levels for each new trading session.
### Trading Applications
Useful for identifying liquidity sweeps, breakouts, reversals, support and resistance, and price acceptance or rejection around previous-session levels.
### Important Notes
Volume profile levels are calculated using an estimated distribution of candle volume across price ranges. Results may differ from TradingView's built-in Volume Profile tools.
Designed for intraday charts, particularly the 5-minute timeframe.
**Disclaimer:** This indicator is intended for educational and technical analysis purposes only. It does not generate buy or sell signals and should not be considered financial advice.
Open-source script
In true TradingView spirit, the creator of this script has made it open-source, so that traders can review and verify its functionality. Kudos to the author! While you can use it for free, remember that republishing the code is subject to our House Rules.

Disclaimer
The information and publications are not meant to be, and do not constitute, financial, investment, trading, or other types of advice or recommendations supplied or endorsed by TradingView. Read more in the Terms of Use.
Open-source script
In true TradingView spirit, the creator of this script has made it open-source, so that traders can review and verify its functionality. Kudos to the author! While you can use it for free, remember that republishing the code is subject to our House Rules.
Disclaimer
The information and publications are not meant to be, and do not constitute, financial, investment, trading, or other types of advice or recommendations supplied or endorsed by TradingView. Read more in the Terms of Use.