FVG Low Momentum Volume Stats
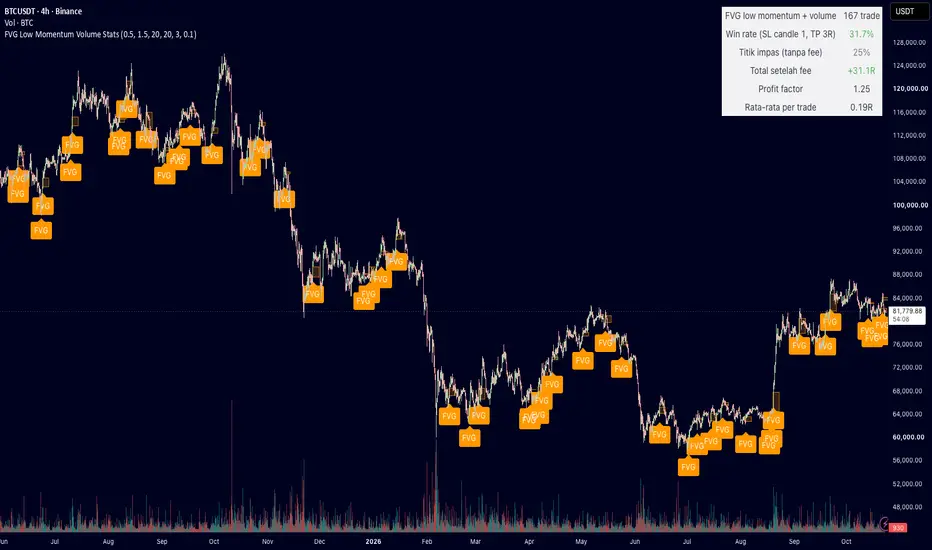
FVG Low Momentum Volume Stats marks bullish fair value gaps (FVG) where the third candle is small ("low momentum") and the middle candle has above-average volume, simulates a limit-entry trade for each gap, and shows the results in a statistics panel.
Rules (all thresholds are inputs):
- Bullish FVG: low of candle 3 above the high of candle 1, candle 2 closes green.
- Low momentum: candle 3 body <= 0.5x candle 2 body AND candle 3 range <= 0.5x candle 2 range.
- Volume: candle 2 volume >= 1.5x the average volume of the previous 20 candles.
Trade simulation:
- Limit entry at the top of the gap if price returns within 20 candles; stop loss at the low of candle 1; take profit at 3R (input). Overlapping trades are allowed; if stop and target are hit in the same candle, the stop is counted first.
- Fees of 0.1% per side are deducted in R.
- The panel shows trades, win rate, break-even win rate for the chosen R, total R after fees, profit factor and average R per trade for the selected date range.
Notes: signals are confirmed on candle close and do not repaint. Historical statistics only; results depend on symbol, timeframe and period; not a trading recommendation.
Rules (all thresholds are inputs):
- Bullish FVG: low of candle 3 above the high of candle 1, candle 2 closes green.
- Low momentum: candle 3 body <= 0.5x candle 2 body AND candle 3 range <= 0.5x candle 2 range.
- Volume: candle 2 volume >= 1.5x the average volume of the previous 20 candles.
Trade simulation:
- Limit entry at the top of the gap if price returns within 20 candles; stop loss at the low of candle 1; take profit at 3R (input). Overlapping trades are allowed; if stop and target are hit in the same candle, the stop is counted first.
- Fees of 0.1% per side are deducted in R.
- The panel shows trades, win rate, break-even win rate for the chosen R, total R after fees, profit factor and average R per trade for the selected date range.
Notes: signals are confirmed on candle close and do not repaint. Historical statistics only; results depend on symbol, timeframe and period; not a trading recommendation.

Disclaimer
The information and publications are not meant to be, and do not constitute, financial, investment, trading, or other types of advice or recommendations supplied or endorsed by TradingView. Read more in the Terms of Use.
Disclaimer
The information and publications are not meant to be, and do not constitute, financial, investment, trading, or other types of advice or recommendations supplied or endorsed by TradingView. Read more in the Terms of Use.