OPEN-SOURCE SCRIPT
Updated Gradient Value Overlay
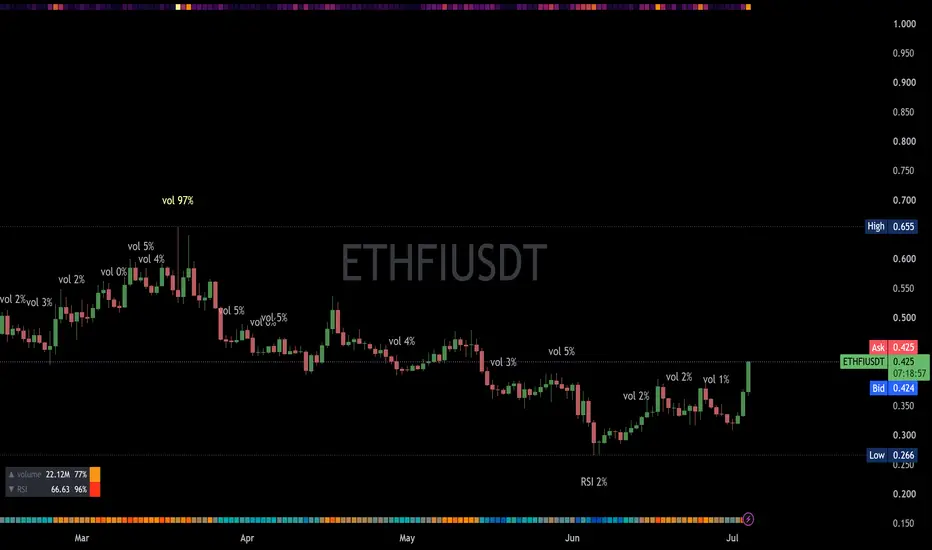
This script helps with identifying certain conditions without cluttering too much of the candles.
Some use cases:
It helps identify rsi low and high values.
Directional price movement becoming difficult.
low and high volume.
it uses a percent rank to distinguish low and high values.
It then uses a gradient to match the percentile rank to heatmap type colors.
i.e. dark blue for lowest volume, white for highest volume.
Current options are:
max bars to use.
approximate color - This value will attempt to give an approximation of what the color might be for the candle close.
e.g. If you're on the 1-hour chart, and only 30 minutes have past, it will multiple the current volume by 1.5. As time passes, if no volume comes in eventually, it will multiply current volume by 1.
This approximate value is only set to work with volume-based options.
option - select the type of value you'd like to see the gradient for.
timeframe - get values from a different chart timeframe.
on/off - turns the gradient on or off.
Gradient type - color wheel or heatmap. Currently these are the only two gardient options.
color wheel's colors for low to high values:
color wheel's current colors:
dark blue
purple
pink
red
orange
yellow
green
teal
white
heatmap's current colors from low values to high values:
dark blue
purple
pink
red
orange
yellow
white
reverse gradient - will reverse the colors so dark blue will be the high value and white will be the low value. Some charts based on previous data; you might need to switch the gradient colors.
moving average length while inside timeframe - an exponential moving average is applied to the values. At 1, there is no moving average applied.
Use case for this is to smooth out the gradient.
An example use case - if your currently on the 1-hour chart, you can set the timeframe to 1 minute and then the moving average length inside timeframe to 60. You will then be seeing the color sixty 1-minute bars.
current timeframe moving average length - an exponential moving average applied to current gradient (helps with smoothing gradient).
Smooth, further smooths values.
There is no set rule for what moving average lengths to use. Adjust timeframe, and moving average lengths to get an insight.
Release Notes
added gaps, moneyflow, price range.Release Notes
corrected "time between candles" to work correctly.Release Notes
I didn't do much testing so hopefully it work.I've made the color wheel gradient colors available for adjustments.
The only way to turn off an individual color is to set it to transparent. If you increase the moving average or smoothing, it will blend the transparent color with neighbouring colors.
The numbers next to the colors are the percent ranks. So the first color dark blue will fall between zero and 3.125.
*note: The time intervals between candle closes no longer work well. Previously, slow moving charts or candles might take 90 seconds until there a chart tick for the candle to be considered to be closed. It now rounds it up to the nearest minute instead of the actual seconds it took for the tick to happen. If you have a premium account, it might still work well if you set it to the seconds timeframe.
Release Notes
GRADIENT VALUE OVERLAY 2.0 — read any value as color, without giving it a paneComplete redesign. Two thin color strips pinned to the top and bottom edges of your chart, each
painting a metric as heat — self-calibrated against its own recent history, so "hot" means hot
for THIS chart recently, not against some fixed bound.
━━━ WHAT A STRIP CAN PAINT ━━━
volume · dollar value · RSI · MFI · Stochastic %K · CCI · Williams %R · ROC % · ADX ·
true range % · ATR % · stdev volatility % · stretch from EMA50 % · body/range % ·
drawdown from N-bar high % · gap % · time between bars · move per volume ·
tick activity (intrabar) · up-volume share % (intrabar) · and the big one:
EXTERNAL SOURCE — add ANY indicator to your chart, pick its plot in the strip's "external
source" input, and the strip becomes a heat readout of that indicator. Any oscillator, any
custom script — painted as color at the chart edge, no pane needed.
Each strip independently: metric, higher timeframe (daily RSI heat while you watch 1h),
smoothing, gradient reverse. Colors are percentile ranks over a rolling window you control.
(The two intrabar tick metrics always compute on the chart timeframe — they can't be re-sampled
to a higher one.)
━━━ PALETTES ━━━
Each strip has its OWN palette: Inferno · Viridis · Plasma · Ice & fire · Green to red ·
Diverging blue-red (for signed metrics like stretch/gap/ROC) · Monochrome · Custom (five stop
colors per strip — not the sixty-eight pickers of the old version). Cold = rank 0,
brightest = rank 100, reversible per strip.
━━━ LEGEND ━━━
Color is fast but numbers matter: an optional mini-legend shows each strip's metric, current
value, percentile and a live color chip — plus position, text size and fine nudge offsets so it
never sits on your OHLC readout.
━━━ EXTREMES SPEAK ━━━
Color is ambient; extremes get loud. When a strip ENTERS its extreme high/low percentile
(thresholds yours): an outlined text tag prints on that bar ("RSI 97%" — top strip above the
bar, bottom strip below, readable on any background), an alert fires (one alert → "Any alert()
function call"), and an optional background flash marks the moment.
━━━ PRESETS ━━━
Volume + RSI (starter) · Momentum — RSI + MFI · Swing — dollar value + range ·
Gap & session watcher (bar spacing + gaps: session breaks, illiquid tape) ·
External — paint another indicator · User defined.
━━━ HONESTY ━━━
The live bar's square updates until the bar closes (and the optional volume projection
estimates the full-bar value while it forms — it settles at the close). Strips stay gray for
the first ~20 closed bars while the calibration builds. Percentile colors are context, not
signals. Not financial advice.
Portions of this script were developed with AI assistance; all logic was reviewed and tested by me.
━━━ CHANGELOG (2.0) ━━━
• Fixed: the "timeframe" setting now actually computes the metric on that timeframe — in the
old version it had no effect on the colors at all.
• Fixed: color calibration now records only CLOSED bars — live-bar ticks used to leak duplicate
entries into the history, subtly corrupting the colors until a refresh.
• Fixed: smoothing switched to a standard EMA — the old custom ramp smoothed live bars
differently than historical ones, and reset after missing-data bars.
• Fixed: the live-bar volume projection now runs only while the bar is actually forming, with a
correct time-remaining calculation.
• Added: external source input — paint any other indicator's plot as a heat strip.
• Added: eleven new metrics — Stochastic, CCI, Williams %R, ROC, ADX, ATR %, stdev volatility,
body/range, drawdown from N-bar high, and intrabar tick activity + up-volume share.
• Added: extreme-event tags on the bars, one-click presets, extreme-percentile alerts,
background flash, and a legend showing the value and percentile behind each color.
• Changed: seven palettes (Inferno / Viridis / Plasma / Ice & fire / Green to red / Diverging /
Monochrome / 5-stop Custom) replace the 68 individual color pickers; the gradient engine is a
fraction of the old size and much lighter on heavy charts.
Open-source script
In true TradingView spirit, the creator of this script has made it open-source, so that traders can review and verify its functionality. Kudos to the author! While you can use it for free, remember that republishing the code is subject to our House Rules.

Disclaimer
The information and publications are not meant to be, and do not constitute, financial, investment, trading, or other types of advice or recommendations supplied or endorsed by TradingView. Read more in the Terms of Use.
Open-source script
In true TradingView spirit, the creator of this script has made it open-source, so that traders can review and verify its functionality. Kudos to the author! While you can use it for free, remember that republishing the code is subject to our House Rules.
Disclaimer
The information and publications are not meant to be, and do not constitute, financial, investment, trading, or other types of advice or recommendations supplied or endorsed by TradingView. Read more in the Terms of Use.