Updated
[blackcat] L2 Moving Average Oscillator
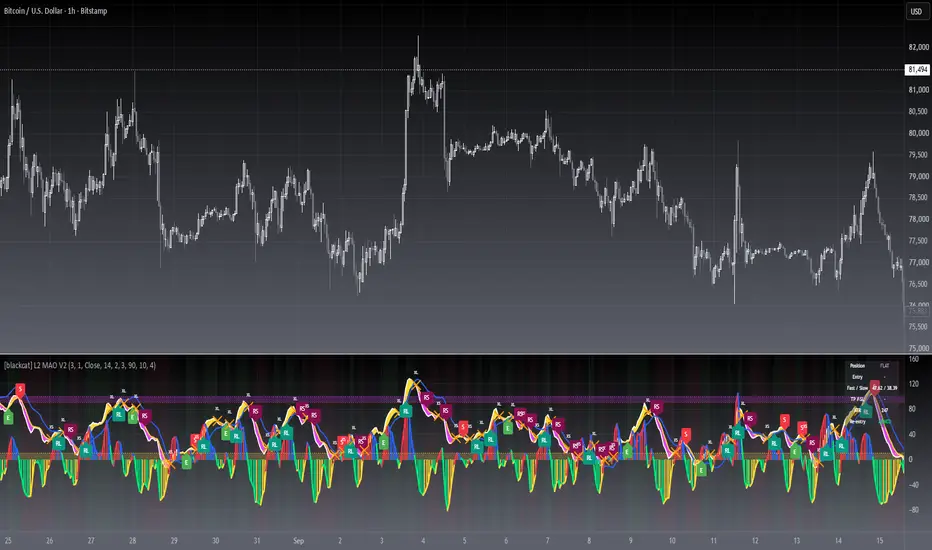
Level: 2
Background
OsMA is an abbreviation for the term Moving Average Oscillator (MAO). The OsMA is a technical indicator that shows the difference between an oscillator and its moving average over a period of time. The MACD is the most commonly used oscillator in the OsMA display, although any oscillator can be used. The MACD has a built-in moving average, which is the signal line. The signal line is an intersection of the MACD line. The OsMA is the difference or the distance between these two lines, which are usually drawn as a histogram. It can provide both a trend confirmation and possible trading signals.
Function
L2 Moving Average Oscillator combines advantages of moving average and oscillator. It can effectively reduce statruation effect of an oscillator under extreme market conditions.
Key Signal
fastline --> MAO fast line
slowline --> MAO slow line
trendline --> more stable trend line of fastline
Pros and Cons
Pros:
1. filter out oscillator fake signal with moving average processing
2. it is an oscillator that can detect overbought and oversold zones effectively
Cons:
1. need to select proper trading pair and time frame
Remarks
My first MAO indicator
Readme
In real life, I am a prolific inventor. I have successfully applied for more than 60 international and regional patents in the past 12 years. But in the past two years or so, I have tried to transfer my creativity to the development of trading strategies. Tradingview is the ideal platform for me. I am selecting and contributing some of the hundreds of scripts to publish in Tradingview community. Welcome everyone to interact with me to discuss these interesting pine scripts.
The scripts posted are categorized into 5 levels according to my efforts or manhours put into these works.
Level 1 : interesting script snippets or distinctive improvement from classic indicators or strategy. Level 1 scripts can usually appear in more complex indicators as a function module or element.
Level 2 : composite indicator/strategy. By selecting or combining several independent or dependent functions or sub indicators in proper way, the composite script exhibits a resonance phenomenon which can filter out noise or fake trading signal to enhance trading confidence level.
Level 3 : comprehensive indicator/strategy. They are simple trading systems based on my strategies. They are commonly containing several or all of entry signal, close signal, stop loss, take profit, re-entry, risk management, and position sizing techniques. Even some interesting fundamental and mass psychological aspects are incorporated.
Level 4 : script snippets or functions that do not disclose source code. Interesting element that can reveal market laws and work as raw material for indicators and strategies. If you find Level 1~2 scripts are helpful, Level 4 is a private version that took me far more efforts to develop.
Level 5 : indicator/strategy that do not disclose source code. private version of Level 3 script with my accumulated script processing skills or a large number of custom functions. I had a private function library built in past two years. Level 5 scripts use many of them to achieve private trading strategy.
Background
OsMA is an abbreviation for the term Moving Average Oscillator (MAO). The OsMA is a technical indicator that shows the difference between an oscillator and its moving average over a period of time. The MACD is the most commonly used oscillator in the OsMA display, although any oscillator can be used. The MACD has a built-in moving average, which is the signal line. The signal line is an intersection of the MACD line. The OsMA is the difference or the distance between these two lines, which are usually drawn as a histogram. It can provide both a trend confirmation and possible trading signals.
Function
L2 Moving Average Oscillator combines advantages of moving average and oscillator. It can effectively reduce statruation effect of an oscillator under extreme market conditions.
Key Signal
fastline --> MAO fast line
slowline --> MAO slow line
trendline --> more stable trend line of fastline
Pros and Cons
Pros:
1. filter out oscillator fake signal with moving average processing
2. it is an oscillator that can detect overbought and oversold zones effectively
Cons:
1. need to select proper trading pair and time frame
Remarks
My first MAO indicator
Readme
In real life, I am a prolific inventor. I have successfully applied for more than 60 international and regional patents in the past 12 years. But in the past two years or so, I have tried to transfer my creativity to the development of trading strategies. Tradingview is the ideal platform for me. I am selecting and contributing some of the hundreds of scripts to publish in Tradingview community. Welcome everyone to interact with me to discuss these interesting pine scripts.
The scripts posted are categorized into 5 levels according to my efforts or manhours put into these works.
Level 1 : interesting script snippets or distinctive improvement from classic indicators or strategy. Level 1 scripts can usually appear in more complex indicators as a function module or element.
Level 2 : composite indicator/strategy. By selecting or combining several independent or dependent functions or sub indicators in proper way, the composite script exhibits a resonance phenomenon which can filter out noise or fake trading signal to enhance trading confidence level.
Level 3 : comprehensive indicator/strategy. They are simple trading systems based on my strategies. They are commonly containing several or all of entry signal, close signal, stop loss, take profit, re-entry, risk management, and position sizing techniques. Even some interesting fundamental and mass psychological aspects are incorporated.
Level 4 : script snippets or functions that do not disclose source code. Interesting element that can reveal market laws and work as raw material for indicators and strategies. If you find Level 1~2 scripts are helpful, Level 4 is a private version that took me far more efforts to develop.
Level 5 : indicator/strategy that do not disclose source code. private version of Level 3 script with my accumulated script processing skills or a large number of custom functions. I had a private function library built in past two years. Level 5 scripts use many of them to achieve private trading strategy.
Release Notes
█ OVERVIEWThe [blackcat] L2 Moving Average Oscillator is a sophisticated technical indicator designed to help traders identify potential buy and sell signals based on price momentum and trends. This script calculates multiple indicators including a fast line, slow line, and trend line to provide insights into market conditions.
█ FEATURES
• Advanced algorithm combining various smoothing techniques such as EMA, SMA, and WSM.
• Visual representation of overbought and oversold levels with customizable thresholds.
• Clear distinction between positive and negative historical data using colored columns.
█ HOW TO USE
1 — Install the script from TradingView's Pine Script editor or directly import it into your chart.
2 — Adjust input parameters if necessary through the settings panel for customization.
3 — Use the generated signals to inform trading decisions:
• Crossovers between the fast and slow lines may indicate short-term entry points.
• Divergences between the price action and the oscillator can signal reversals.
• Monitor column colors in the histogram for momentum strength.
█ LIMITATIONS
• The effectiveness of this strategy depends heavily on the time frame used; backtest thoroughly before live deployment.
• Historical performance does not guarantee future results.
• May produce false signals during choppy markets without proper filtering methods.
Release Notes
█ OVERVIEWblackcat L2 Moving Average Oscillator is a composite momentum oscillator that condenses several normalized price-position and volatility components into three smoothed lines — Fast, Slow and Trend — and turns their crossings into a complete, state-aware signal suite with trend/zone noise filters, re-entry signals and ATR-based risk levels.
This polished V2 keeps the original core math untouched and adds entry/exit and re-entry labels, position tracking, a status dashboard and full alert support.
█ CONCEPTS
The oscillator fuses multiple views of the market into one pane:
• Composite Engine: stochastic-style price positioning over long and short windows, deviation-normalized momentum, and volatility-scaled pressure are blended and double-smoothed
• Fast/Slow Crossing: the Fast Line crossing the Slow Line marks momentum shifts in both directions
• Noise Filtering: a trendline-direction filter keeps entries aligned with the prevailing slope, and a zone filter blocks chasing entries when the oscillator is already at an extreme
• Stop-and-Reverse State Machine: a position state (long / flat / short) ensures signals alternate logically; a reversal cross exits one side and opens the other on the same bar
• Re-entry (RL/RS): after a cooldown-blocked exit, the exit-bar extremes become anchors; breaking above the high anchor re-enters long (RL), breaking below the low anchor re-enters short (RS) — one clean shot per exit, re-armed only by the next exit
• Signal Governance: an adjustable cooldown suppresses rapid re-triggering in choppy conditions
• Volatility-Based Risk: stop-loss and take-profit reference levels are derived from ATR multiples of the entry price
█ HOW TO USE
1 — Add the indicator to a standard candlestick chart; it renders in its own pane below the price
2 — Tune the Signal Engine, Re-entry and Risk groups if signals fire too often or risk levels feel too tight; defaults work out of the box
3 — Read signals from the labels and let alerts do the monitoring; use the dashboard to check the current state and re-entry arming at a glance
Input Parameters
• Cooldown Bars (default 3): minimum bars between entry signals; 0 disables the cooldown
• Trend Filter (default on): requires the Trend Line slope to agree with the entry direction
• Zone Filter (default on): blocks long entries when the Fast Line is already overbought and short entries when the Slow Line is already oversold
• Enable Re-entry RL/RS (default on): master switch for anchor-based re-entry signals
• Anchor Window Around Exit Bar (default 1): half-width of the window used to set the exit-bar extreme anchors
• Breakout Source (Close or High/Low): which price must break the anchor to trigger RL/RS
• ATR Length (default 14): lookback for the average true range used by risk levels
• Stop Loss xATR (default 2.0): stop distance as a multiple of ATR
• Take Profit xATR (default 3.0): target distance as a multiple of ATR
• Show TP/SL Levels (default on): plot the active stop and target lines
• Overbought Level (default 90) / Oversold Level (default 10): dotted guide thresholds and shaded bands
• Histogram Multiplier (default 4.0): visual scaling of the Fast-Slow difference columns
• Show Entry/Exit Labels (default on): toggle the E / S / RL / RS / XL / XS markers
• Position State Background (default on): faint green/red backdrop while long/short
• Show Dashboard (default on): status table in the top-right corner
█ FEATURES
• Symmetric long and short signals with stop-and-reverse logic
• Trend and zone filters to cut false crosses, plus cooldown-gated entries
• Paired re-entry signals: RL rejoins longs, RS rejoins shorts after a shakeout exit
• ATR-multiple stop-loss and take-profit reference lines that follow the active position
• Full alert suite: six named alert conditions plus dynamic close-confirmed alerts
• On-chart status dashboard: position, entry price, Fast/Slow values, TP/SL, ATR and re-entry arming
• Clean pane management: labels are capped, state values go to the data window
█ SIGNALS
Visual Elements
• E (green label below): Fast Line crossed over Slow Line and filters allow — long entry
• S (red label above): Fast Line crossed under Slow Line and filters allow — short entry
• RL (teal label below): re-entry long — price closed above the exit-bar high anchor
• RS (maroon label above): re-entry short — price closed below the exit-bar low anchor
• XL / XS (orange cross): long / short exit when a reversal entry is blocked by filters or cooldown
• Histogram columns red/blue: positive and rising / positive and falling; lime/yellow: negative and falling / negative and rising
• White / yellow / blue lines: Fast / Slow / Trend; yellow-fuchsia fill marks the Fast-Slow relationship
• Dotted thresholds with shaded bands: overbought and oversold zones
• Red / teal step lines: active stop-loss / take-profit reference levels
█ IMPLEMENTATION NOTES
Open source, Pine v6. Built on ta.ema, ta.sma, ta.stdev, ta.dev, ta.highest/ta.lowest and ta.atr; signals are edge-based via ta.crossover / ta.crossunder and arbitrated by a var-based position state machine. Re-entry anchors are captured once on the exit bar and consumed on first breakout (single-fire). All alerts confirm on bar close; no request.security is used, so nothing repaints after the closing tick. Signal core:
█ LIMITATIONS
• Crossing systems generate false signals in sideways markets; filters and the cooldown soften but do not eliminate them
• Strict filtering delays entries: in fast reversals the trend/zone filters may skip the first cross
• The oscillator scale is synthetic — its 0-100 guide levels are reference zones, not percentages
• This is an indicator, not a strategy: TP/SL lines are reference levels, not simulated orders
• Signals confirm at bar close; intrabar line movement is not a signal
█ NOTES
• Based on the original blackcat L2 Moving Average Oscillator; V2 adds the filtering, governance, risk and visualization layers
• Free to use and modify — attribution appreciated
════════════════════════════════════════════════════════════════════════
For questions or feedback, please use the comments section below.
Feel free to use and modify — attribution appreciated.

Don't miss out! The first and most important thing to do is to join my Discord chat now! Click here to start your adventure: discord.com/invite/ZTGpQJq My new github for more pine development soon: github.com/wxt-coder
Disclaimer
The information and publications are not meant to be, and do not constitute, financial, investment, trading, or other types of advice or recommendations supplied or endorsed by TradingView. Read more in the Terms of Use.
Don't miss out! The first and most important thing to do is to join my Discord chat now! Click here to start your adventure: discord.com/invite/ZTGpQJq My new github for more pine development soon: github.com/wxt-coder
Disclaimer
The information and publications are not meant to be, and do not constitute, financial, investment, trading, or other types of advice or recommendations supplied or endorsed by TradingView. Read more in the Terms of Use.