OPEN-SOURCE SCRIPT
Bitcoin 1-Year Running ROI Risk Metric
Overview
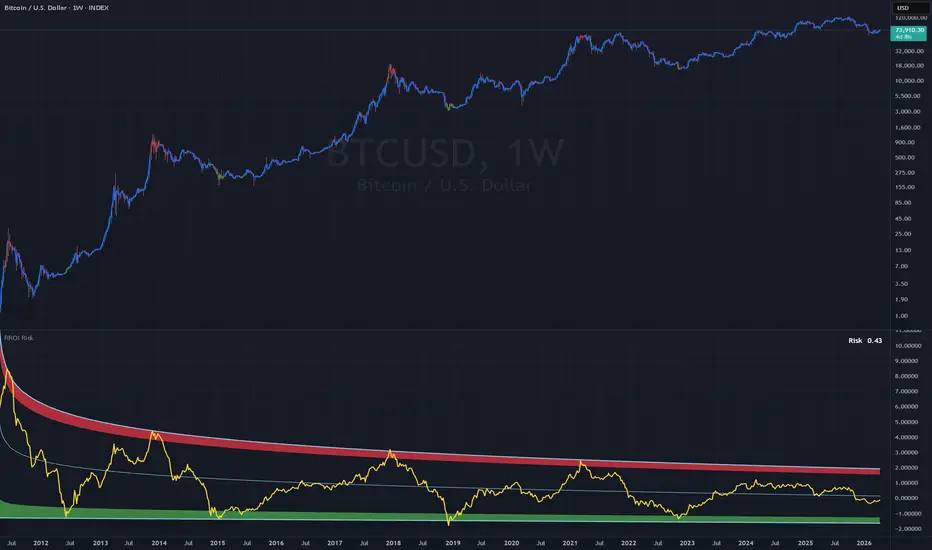
The Bitcoin 1-Year Running ROI Risk Metric is a macro-analysis oscillator designed to evaluate the current stage of Bitcoin's market cycle. By analyzing the 1-year rolling Return on Investment (ROI) and applying regression models to historical peaks and troughs, it translates raw market data into a normalized Risk score ranging from 0 to 1.
How it Works
Historically, due to the law of diminishing returns, Bitcoin's cycle peaks yield a progressively lower ROI each macro cycle. This indicator accounts for this phenomenon by fitting bounding regression curves to historical cycle extremes.
The script calculates the natural logarithm of the 1-year ROI. It then normalizes this value between a fitted bottom line (representing historical bear market bottoms) and a fitted top line (representing historical bull market peaks).
Settings & Customization
Users can customize the indicator's behavior and visuals through the settings menu:
💡 Visualization Tip
The script projects a colored price line directly onto your main chart (Green for Buy Zone, Red for Sell Zone).
Limitations & Disclaimers
Please keep the following points in mind when using this tool:
The Bitcoin 1-Year Running ROI Risk Metric is a macro-analysis oscillator designed to evaluate the current stage of Bitcoin's market cycle. By analyzing the 1-year rolling Return on Investment (ROI) and applying regression models to historical peaks and troughs, it translates raw market data into a normalized Risk score ranging from 0 to 1.
How it Works
Historically, due to the law of diminishing returns, Bitcoin's cycle peaks yield a progressively lower ROI each macro cycle. This indicator accounts for this phenomenon by fitting bounding regression curves to historical cycle extremes.
The script calculates the natural logarithm of the 1-year ROI. It then normalizes this value between a fitted bottom line (representing historical bear market bottoms) and a fitted top line (representing historical bull market peaks).
- A Risk value near 0 (or inside the Buy Zone) indicates historical bear market lows, representing minimal macro risk and potential accumulation zones.
- A Risk value near 1 (or inside the Sell Zone) suggests the market is approaching the historical limits of diminishing returns, indicating maximum macro risk and potential cycle tops.
Settings & Customization
Users can customize the indicator's behavior and visuals through the settings menu:
- Top Line: Select the mathematical model used for the upper boundary of the market cycle. Choose between a Log Fit (logarithmic regression, which best captures all historical tops) or a Linear Fit (a more conservative straight line that excludes the 2011 peak).
- View: Switch between the Normalized mode (displays the Risk metric as a clean 0 to 1 oscillator) and the Fit Lines mode (displays the raw logarithmic ROI values along with the upper, middle, and lower regression bands).
- Sell / Buy Zone Levels: Adjust the thresholds that define the extreme risk areas. By default, the Sell Zone starts at 0.90 and the Buy Zone at 0.10. These values dictate when the oscillator and the main chart price line change colors.
- Plot on the Main Pane: A simple toggle to turn the colored price line overlay on your main chart on or off.
💡 Visualization Tip
The script projects a colored price line directly onto your main chart (Green for Buy Zone, Red for Sell Zone).
- To see this colored indicator line clearly without visual clutter, you can hide the standard Bitcoin price candles using the chart's object tree or settings.
- Conversely, if you prefer a clean main chart and only want to view the risk oscillator in the lower pane, simply uncheck the "Plot on the Main Pane" option in the indicator's settings.
Limitations & Disclaimers
Please keep the following points in mind when using this tool:
- Asset Specific: This indicator is strictly designed for Bitcoin. It internally fetches data using the INDEX:BTCUSD ticker. While you can load it on any other asset's chart, the oscillator in the lower pane will always display Bitcoin's data.
- Timeframe Dependency: Although the indicator will calculate on any timeframe, it is highly recommended to use the Weekly (1W) chart. The regression curve fitting was performed using weekly closes. On other timeframes, the regression boundaries may not align perfectly with the exact global tops and bottoms.
- Hardcoded Coefficients: The curve fitting was calculated based on Bitcoin's global tops and bottoms up to the year 2023. The resulting mathematical coefficients are hardcoded into the script. Future macro cycles may require a new approximation and an update to these coefficients.
- Linear Fit Outlier: If you select the "Linear Fit" option for the Top Line in the settings, note that this model intentionally ignores the 2011 global top, treating it as a statistical outlier. This linear boundary is guaranteed to be broken by future price action, but it can serve as a "conservative" macro target in the meantime.
- No Guarantees: There is no guarantee that Bitcoin's price or ROI will reach the upper or lower boundaries in the future, nor is it guaranteed to remain within them. This indicator is for educational and macro-analysis purposes only and does not constitute financial advice.
Open-source script
In true TradingView spirit, the creator of this script has made it open-source, so that traders can review and verify its functionality. Kudos to the author! While you can use it for free, remember that republishing the code is subject to our House Rules.

Disclaimer
The information and publications are not meant to be, and do not constitute, financial, investment, trading, or other types of advice or recommendations supplied or endorsed by TradingView. Read more in the Terms of Use.
Open-source script
In true TradingView spirit, the creator of this script has made it open-source, so that traders can review and verify its functionality. Kudos to the author! While you can use it for free, remember that republishing the code is subject to our House Rules.
Disclaimer
The information and publications are not meant to be, and do not constitute, financial, investment, trading, or other types of advice or recommendations supplied or endorsed by TradingView. Read more in the Terms of Use.