Volatility Concentration Audit
Purpose
A volatility reading can be driven by one unusually large return or by many ordinary returns. Those windows can have a similar average squared return but very different composition. Volatility Concentration Audit makes that distinction visible, then shows how much the root-mean-square (RMS) return changes when the single largest absolute return is excluded.
This is a descriptive research indicator. It provides no entry, exit, direction forecast or position-size recommendation.
What the chart shows
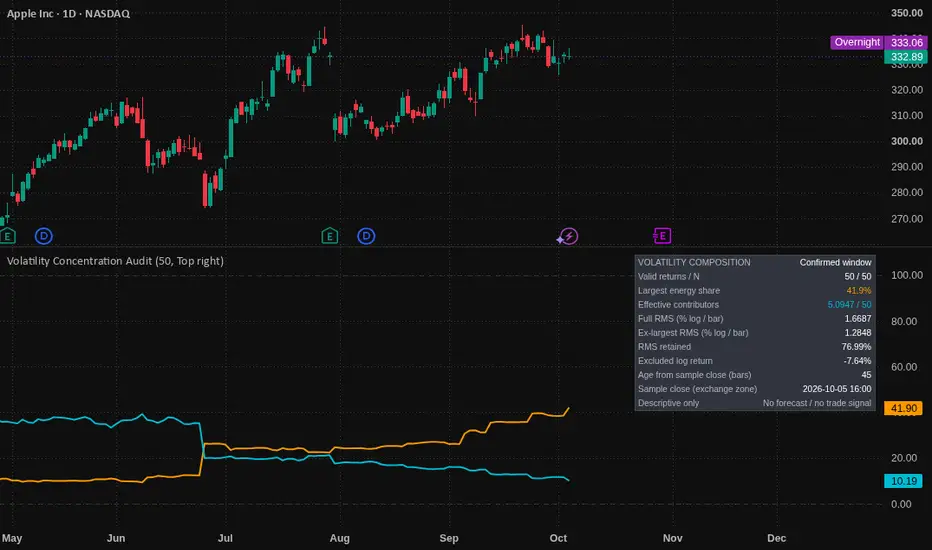
Orange: the largest squared log return as a percentage of all squared log returns in the window. A higher value means one observation dominates more of the measured movement.
Aqua: effective contributing returns divided by the window length, expressed as a percentage. This uses every observation's share, so it distinguishes a window dominated by a few large returns from one with broadly distributed contributions.
The table adds the equivalent contributor count, full-window RMS, RMS after excluding one largest return, the percentage of RMS retained, and the excluded return's signed value and age. Age zero means the latest confirmed return in the sample. The sample-close timestamp uses the symbol's exchange timezone. The table describes the latest confirmed window, even when the crosshair is over an older bar. Historical values are available in the Data Window.
Method
Choose N confirmed returns. The default is 50, with a supported range of 5 to 500. The default is an illustrative research window and was not optimized for trading results.
Each return is r = ln(close) - ln(previous close). The window contains exactly N consecutive chart returns, requiring N+1 positive closes. Define e = r squared, S = sum(e), and M = largest(e).
- Largest share = 100 * M / S.
- Effective contributors = S squared / sum(e squared).
- Aqua plot = 100 * effective contributors / N.
- Full RMS = 100 * sqrt(S / N).
- Ex-largest RMS = 100 * sqrt(sum of surviving e / (N-1)).
- RMS retained = 100 * ex-largest RMS / full RMS.
The RMS values and excluded return use log-return percentage units. They are per-chart-bar values, without annualization or subtraction of the mean. RMS therefore differs from centered standard deviation.
The implementation normalizes returns by the largest absolute return before squaring. It also sums the surviving observations directly, avoiding subtraction of nearly equal totals in the leave-one-out calculation. If several returns tie for the largest absolute value, it excludes the most recent one only. All-zero windows show RMS zero and undefined concentration fields. A missing or nonpositive close invalidates the affected window rather than being silently skipped.
How to interpret it
With equal nonzero return magnitudes, the largest share is 100/N, effective contributors equals N, and excluding one return leaves RMS unchanged. With only one nonzero return, the largest share is 100%, effective contributors equals one, and ex-largest RMS becomes zero.
For an arithmetic example, consider five log returns in percentage units: 1, 1, 1, 1 and 4. Their squared values sum to 20. The largest share is 80%, effective contributors is about 1.54 out of five, full RMS is 2%, and ex-largest RMS is 1%. RMS retained is 50%. This illustrates the calculation, not a market result.
Use the tool to inspect the observations behind a volatility summary before comparing different periods. A jump when an old large return leaves the rolling window can be a window-composition effect. The excluded return's age helps identify that mechanism. Removing an observation here is a sensitivity exercise: the large move remains part of the historical record and may be economically important.
What is distinct about this implementation
The concentration and RMS formulas are standard mathematics. This original Pine implementation applies them together to one exact, confirmed-return window and links three practical questions: how dominant is the largest observation, how broadly is squared movement distributed, and how sensitive is the RMS summary to that observation? The timestamp, exact-window validation, deterministic tie handling and excluded-return age make the calculation inspectable. No code was copied or imported from another author's script. It is separate from the author's breakout-event and elapsed-clock diagnostics because it studies the distribution of return magnitudes rather than event outcomes or elapsed time.
Timing and limitations
Calculations commit only when the chart bar closes. The open bar has no provisional plot point, and the table retains the last confirmed sample. There are no higher-timeframe requests, lookahead, future references or plots shifted into the past. Historical source-data corrections, adjustment settings and changes to the symbol, timeframe, session or inputs can still change recalculated results.
Use standard time-based charts. Synthetic chart types are suppressed with an explanatory table message. Session gaps and overnight moves are included in close-to-close returns. Bar durations can differ, particularly around session boundaries. Different feeds and adjustment settings can produce different readings. Ordinary floating-point rounding still applies.
Effective contributors is an equivalent count of equally energetic returns, not an estimate of statistically independent observations or a confidence level. RMS retention is mathematically determined by the largest share and N; it is an alternate sensitivity interpretation, not an independent confirmation signal. The tool uses closing prices and does not measure intrabar extremes, execution costs, liquidity or future risk. No universal good/bad threshold is implied.
Validation
The saved Pine v6 source was compiled and exercised on BTCUSD 1-minute and 1-hour charts and AAPL 1-hour and daily charts. Minimum and maximum windows and the Heikin Ashi guard were checked. Independent reference testing covered 37 cases, including 1,000 high-precision randomized comparisons. Exported TradingView values matched the reference across 499 reconstructible windows and eight outputs per window on BTCUSD 1-minute and AAPL daily data, within numerical rounding. These checks validate calculations and behavior, not predictive value or trading performance.
Free, open-source educational indicator.
A volatility reading can be driven by one unusually large return or by many ordinary returns. Those windows can have a similar average squared return but very different composition. Volatility Concentration Audit makes that distinction visible, then shows how much the root-mean-square (RMS) return changes when the single largest absolute return is excluded.
This is a descriptive research indicator. It provides no entry, exit, direction forecast or position-size recommendation.
What the chart shows
Orange: the largest squared log return as a percentage of all squared log returns in the window. A higher value means one observation dominates more of the measured movement.
Aqua: effective contributing returns divided by the window length, expressed as a percentage. This uses every observation's share, so it distinguishes a window dominated by a few large returns from one with broadly distributed contributions.
The table adds the equivalent contributor count, full-window RMS, RMS after excluding one largest return, the percentage of RMS retained, and the excluded return's signed value and age. Age zero means the latest confirmed return in the sample. The sample-close timestamp uses the symbol's exchange timezone. The table describes the latest confirmed window, even when the crosshair is over an older bar. Historical values are available in the Data Window.
Method
Choose N confirmed returns. The default is 50, with a supported range of 5 to 500. The default is an illustrative research window and was not optimized for trading results.
Each return is r = ln(close) - ln(previous close). The window contains exactly N consecutive chart returns, requiring N+1 positive closes. Define e = r squared, S = sum(e), and M = largest(e).
- Largest share = 100 * M / S.
- Effective contributors = S squared / sum(e squared).
- Aqua plot = 100 * effective contributors / N.
- Full RMS = 100 * sqrt(S / N).
- Ex-largest RMS = 100 * sqrt(sum of surviving e / (N-1)).
- RMS retained = 100 * ex-largest RMS / full RMS.
The RMS values and excluded return use log-return percentage units. They are per-chart-bar values, without annualization or subtraction of the mean. RMS therefore differs from centered standard deviation.
The implementation normalizes returns by the largest absolute return before squaring. It also sums the surviving observations directly, avoiding subtraction of nearly equal totals in the leave-one-out calculation. If several returns tie for the largest absolute value, it excludes the most recent one only. All-zero windows show RMS zero and undefined concentration fields. A missing or nonpositive close invalidates the affected window rather than being silently skipped.
How to interpret it
With equal nonzero return magnitudes, the largest share is 100/N, effective contributors equals N, and excluding one return leaves RMS unchanged. With only one nonzero return, the largest share is 100%, effective contributors equals one, and ex-largest RMS becomes zero.
For an arithmetic example, consider five log returns in percentage units: 1, 1, 1, 1 and 4. Their squared values sum to 20. The largest share is 80%, effective contributors is about 1.54 out of five, full RMS is 2%, and ex-largest RMS is 1%. RMS retained is 50%. This illustrates the calculation, not a market result.
Use the tool to inspect the observations behind a volatility summary before comparing different periods. A jump when an old large return leaves the rolling window can be a window-composition effect. The excluded return's age helps identify that mechanism. Removing an observation here is a sensitivity exercise: the large move remains part of the historical record and may be economically important.
What is distinct about this implementation
The concentration and RMS formulas are standard mathematics. This original Pine implementation applies them together to one exact, confirmed-return window and links three practical questions: how dominant is the largest observation, how broadly is squared movement distributed, and how sensitive is the RMS summary to that observation? The timestamp, exact-window validation, deterministic tie handling and excluded-return age make the calculation inspectable. No code was copied or imported from another author's script. It is separate from the author's breakout-event and elapsed-clock diagnostics because it studies the distribution of return magnitudes rather than event outcomes or elapsed time.
Timing and limitations
Calculations commit only when the chart bar closes. The open bar has no provisional plot point, and the table retains the last confirmed sample. There are no higher-timeframe requests, lookahead, future references or plots shifted into the past. Historical source-data corrections, adjustment settings and changes to the symbol, timeframe, session or inputs can still change recalculated results.
Use standard time-based charts. Synthetic chart types are suppressed with an explanatory table message. Session gaps and overnight moves are included in close-to-close returns. Bar durations can differ, particularly around session boundaries. Different feeds and adjustment settings can produce different readings. Ordinary floating-point rounding still applies.
Effective contributors is an equivalent count of equally energetic returns, not an estimate of statistically independent observations or a confidence level. RMS retention is mathematically determined by the largest share and N; it is an alternate sensitivity interpretation, not an independent confirmation signal. The tool uses closing prices and does not measure intrabar extremes, execution costs, liquidity or future risk. No universal good/bad threshold is implied.
Validation
The saved Pine v6 source was compiled and exercised on BTCUSD 1-minute and 1-hour charts and AAPL 1-hour and daily charts. Minimum and maximum windows and the Heikin Ashi guard were checked. Independent reference testing covered 37 cases, including 1,000 high-precision randomized comparisons. Exported TradingView values matched the reference across 499 reconstructible windows and eight outputs per window on BTCUSD 1-minute and AAPL daily data, within numerical rounding. These checks validate calculations and behavior, not predictive value or trading performance.
Free, open-source educational indicator.

Disclaimer
The information and publications are not meant to be, and do not constitute, financial, investment, trading, or other types of advice or recommendations supplied or endorsed by TradingView. Read more in the Terms of Use.
Disclaimer
The information and publications are not meant to be, and do not constitute, financial, investment, trading, or other types of advice or recommendations supplied or endorsed by TradingView. Read more in the Terms of Use.