OPEN-SOURCE SCRIPT
ADX Compass [Quantum Algo]
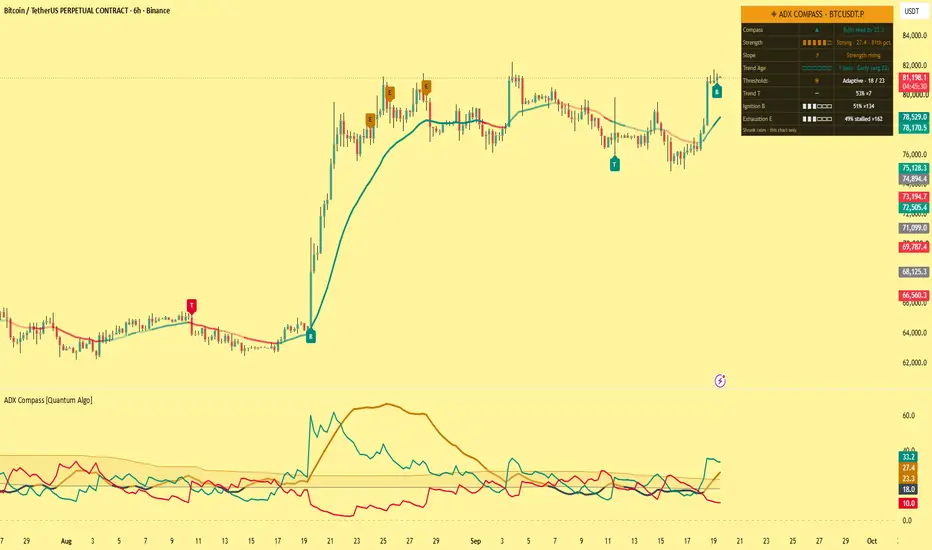
ADX Compass [Quantum Algo]
═══════════════════════════════════════════════
🔶 OVERVIEW
ADX Compass turns the Average Directional Index into an instrument you can steer by. It answers the four questions the raw index never answers cleanly: how strong is this trend for THIS symbol, which side is driving it, how old is it compared with this market's typical trend, and is it about to fail — and then paints the answers onto the price chart as a strength aura and a directional ribbon, so the reading lives on the candles.
The central upgrade is adaptive strength. Fixed levels like 20 and 25 mean different things on every symbol and timeframe. This tool ranks the index against its own recent history, so "weak" and "strong" are defined by the market you are actually looking at. On top of that it measures trend age against the symbol's own average trend lifespan, filters directional crosses by strength, detects exhaustion as the index turns from a strong peak, and scores each signal family on your exact chart.
═══════════════════════════════════════════════
🔶 WHAT IS THE ADX?
The Average Directional Index, created by J. Welles Wilder Jr., measures the STRENGTH of a trend without regard to its direction. It is derived from Directional Movement: +DI measures upward pressure, −DI measures downward pressure, and the index smooths the spread between them. A rising index means a trend — up or down — is gaining force; a falling index means it is losing force. Direction comes from which directional line is on top.
═══════════════════════════════════════════════
🔶 WHY FIXED ADX LEVELS FAIL
The traditional rule — above 25 means trending — was calibrated on the markets of its era. A quiet index may spend years rarely reaching 25 while a volatile pair lives above it in what is effectively a range. ADX Compass replaces the constant with a percentile rank inside the symbol's recent history: weak below the 30th percentile, building in between, strong above the 70th. The classic fixed levels remain available as a toggle, and the dashboard always shows the live thresholds in use.
═══════════════════════════════════════════════
🔶 WHY IS THIS ORIGINAL?
1. Adaptive strength ranking. Weak, Building and Strong are defined by the symbol's own distribution, never by a hard-coded number, with the live thresholds displayed.
2. Trend Age. When strength enters the strong zone a trend clock starts. Its reading is compared against the average lifespan of this symbol's recent trends and labeled Early, Mature or Late — a maturity gauge that warns before the index visibly rolls over.
3. Strength-filtered directional signals. The T family fires on a directional cross only when strength is already present and rising, removing the whipsaw crosses that make raw Directional Movement unusable in ranges.
4. Ignition and Exhaustion as first-class events. B marks the index breaking into its strong zone with the dominant side; E marks the index turning down from a strong peak — the earliest measurable sign a trend is losing force.
5. The reading on the price chart. A strength aura tints the background in the dominant side's color, intensifying with strength; a directional ribbon through price whose opacity IS the index — bold in strong trends, ghosted in chop.
6. Per-family statistics. Each family's ten-bar outcomes are tracked on your chart, shrunk toward neutral at small samples with a Wilson lower bound, and quoted in every signal's tooltip and on the dashboard.
═══════════════════════════════════════════════
🔶 HOW IT WORKS
— Directional Movement and the index are computed with Wilder's smoothing at configurable lengths.
— The index is ranked inside its history window to derive adaptive thresholds and the current percentile.
— A trend clock runs while strength is strong; completed trend lengths feed the average lifespan used for the maturity label.
— Signals are evaluated on confirmed bars: T on filtered directional crosses, B on strength ignition, E on a confirmed peak-turn in the strong zone.
— Every family feeds its own first-in-first-out outcome samples; the E family is scored on whether the trend actually stalled.
Signals do not repaint. All drawings are capped for performance.
═══════════════════════════════════════════════
🔶 HOW TO USE IT
— Trade the ribbon's opacity: bold ribbon and a full aura mean trend strategies are in their habitat; a ghosted ribbon means range tactics.
— Respect Trend Age: Early trends favor entries on pullbacks, Late trends favor tightening risk and taking profit; the E signal is the confirmation that a Late trend is failing.
— Use B as the regime trigger: strength ignition with the dominant side tells you a range just ended and which way.
— Read the family records before trusting a letter — they tell you how this symbol has historically honored each event.
— Works on all markets and timeframes; the adaptive thresholds recalibrate wherever you load it.
═══════════════════════════════════════════════
🔶 SETTINGS
— Directional Index: directional length, index smoothing, adaptive toggle, fixed levels, history window.
— Signals: visibility, cooldown.
— Statistics: sample cap, minimum samples, shrinkage strength, Wilson z-score.
— Visuals and dashboard: aura and ribbon toggles, ribbon length, full color and position control.
═══════════════════════════════════════════════
🔶 ALERTS
— Directional Cross — the directional lines crossed with strength present and rising.
— Strength Ignition — the index broke into its strong zone.
— Trend Exhaustion — the index turned down from a strong peak.
— Strong Trend Began — adaptive strength entered the strong zone.
═══════════════════════════════════════════════
🔶 FAQ
Q: Does it repaint?
A: No. Signals are evaluated on confirmed bars and never change once printed. The adaptive thresholds move slowly as the history window rolls, but past signals are not re-evaluated.
Q: Does the ADX show direction?
A: The index itself does not — it measures strength only. Direction comes from the directional lines, which this tool reads for you as the Compass row, the aura color and the ribbon color.
Q: Why does the ribbon fade?
A: Its opacity is tied to strength. A faint ribbon is not a bug — it is the tool telling you the trend has no force behind it.
Q: What does "Late" mean in Trend Age?
A: The current trend has already lasted longer than this symbol's average trend. It is not a sell signal; it is a maturity reading that raises the value of the exhaustion signal when it comes.
Q: What do the family percentages mean?
A: The share of past signals in that family after which price had moved favorably ten bars later (for E, the share after which the trend stalled), on the current symbol and timeframe, shrunk toward fifty percent at small samples. They describe history — they are not predictions.
═══════════════════════════════════════════════
🔶 CREDITS
The Average Directional Index, the Directional Movement system and the Average True Range are by J. Welles Wilder Jr. (New Concepts in Technical Trading Systems, 1978). The Wilson score interval is by Edwin B. Wilson (1927). The adaptive strength ranking, trend-age model, signal families, per-symbol statistics, on-chart rendering and all code in this script are original work — no third-party or open-source script code was reused.
═══════════════════════════════════════════════
🔶 LIMITATIONS
— The index is a smoothed, lagging measure; adaptive ranking sharpens its reading but cannot remove the lag.
— Trend Age needs several completed trends on the chart before the average lifespan is meaningful.
— Statistics describe the current chart's history only; past frequencies never guarantee future outcomes.
═══════════════════════════════════════════════
🔶 DISCLAIMER
This indicator is a research and charting tool provided for educational purposes. It is not financial advice, and nothing it displays is a recommendation to buy or sell any asset. Trading involves substantial risk of loss. Always do your own analysis and manage risk responsibly.
═══════════════════════════════════════════════
🔶 OVERVIEW
ADX Compass turns the Average Directional Index into an instrument you can steer by. It answers the four questions the raw index never answers cleanly: how strong is this trend for THIS symbol, which side is driving it, how old is it compared with this market's typical trend, and is it about to fail — and then paints the answers onto the price chart as a strength aura and a directional ribbon, so the reading lives on the candles.
The central upgrade is adaptive strength. Fixed levels like 20 and 25 mean different things on every symbol and timeframe. This tool ranks the index against its own recent history, so "weak" and "strong" are defined by the market you are actually looking at. On top of that it measures trend age against the symbol's own average trend lifespan, filters directional crosses by strength, detects exhaustion as the index turns from a strong peak, and scores each signal family on your exact chart.
═══════════════════════════════════════════════
🔶 WHAT IS THE ADX?
The Average Directional Index, created by J. Welles Wilder Jr., measures the STRENGTH of a trend without regard to its direction. It is derived from Directional Movement: +DI measures upward pressure, −DI measures downward pressure, and the index smooths the spread between them. A rising index means a trend — up or down — is gaining force; a falling index means it is losing force. Direction comes from which directional line is on top.
═══════════════════════════════════════════════
🔶 WHY FIXED ADX LEVELS FAIL
The traditional rule — above 25 means trending — was calibrated on the markets of its era. A quiet index may spend years rarely reaching 25 while a volatile pair lives above it in what is effectively a range. ADX Compass replaces the constant with a percentile rank inside the symbol's recent history: weak below the 30th percentile, building in between, strong above the 70th. The classic fixed levels remain available as a toggle, and the dashboard always shows the live thresholds in use.
═══════════════════════════════════════════════
🔶 WHY IS THIS ORIGINAL?
1. Adaptive strength ranking. Weak, Building and Strong are defined by the symbol's own distribution, never by a hard-coded number, with the live thresholds displayed.
2. Trend Age. When strength enters the strong zone a trend clock starts. Its reading is compared against the average lifespan of this symbol's recent trends and labeled Early, Mature or Late — a maturity gauge that warns before the index visibly rolls over.
3. Strength-filtered directional signals. The T family fires on a directional cross only when strength is already present and rising, removing the whipsaw crosses that make raw Directional Movement unusable in ranges.
4. Ignition and Exhaustion as first-class events. B marks the index breaking into its strong zone with the dominant side; E marks the index turning down from a strong peak — the earliest measurable sign a trend is losing force.
5. The reading on the price chart. A strength aura tints the background in the dominant side's color, intensifying with strength; a directional ribbon through price whose opacity IS the index — bold in strong trends, ghosted in chop.
6. Per-family statistics. Each family's ten-bar outcomes are tracked on your chart, shrunk toward neutral at small samples with a Wilson lower bound, and quoted in every signal's tooltip and on the dashboard.
═══════════════════════════════════════════════
🔶 HOW IT WORKS
— Directional Movement and the index are computed with Wilder's smoothing at configurable lengths.
— The index is ranked inside its history window to derive adaptive thresholds and the current percentile.
— A trend clock runs while strength is strong; completed trend lengths feed the average lifespan used for the maturity label.
— Signals are evaluated on confirmed bars: T on filtered directional crosses, B on strength ignition, E on a confirmed peak-turn in the strong zone.
— Every family feeds its own first-in-first-out outcome samples; the E family is scored on whether the trend actually stalled.
Signals do not repaint. All drawings are capped for performance.
═══════════════════════════════════════════════
🔶 HOW TO USE IT
— Trade the ribbon's opacity: bold ribbon and a full aura mean trend strategies are in their habitat; a ghosted ribbon means range tactics.
— Respect Trend Age: Early trends favor entries on pullbacks, Late trends favor tightening risk and taking profit; the E signal is the confirmation that a Late trend is failing.
— Use B as the regime trigger: strength ignition with the dominant side tells you a range just ended and which way.
— Read the family records before trusting a letter — they tell you how this symbol has historically honored each event.
— Works on all markets and timeframes; the adaptive thresholds recalibrate wherever you load it.
═══════════════════════════════════════════════
🔶 SETTINGS
— Directional Index: directional length, index smoothing, adaptive toggle, fixed levels, history window.
— Signals: visibility, cooldown.
— Statistics: sample cap, minimum samples, shrinkage strength, Wilson z-score.
— Visuals and dashboard: aura and ribbon toggles, ribbon length, full color and position control.
═══════════════════════════════════════════════
🔶 ALERTS
— Directional Cross — the directional lines crossed with strength present and rising.
— Strength Ignition — the index broke into its strong zone.
— Trend Exhaustion — the index turned down from a strong peak.
— Strong Trend Began — adaptive strength entered the strong zone.
═══════════════════════════════════════════════
🔶 FAQ
Q: Does it repaint?
A: No. Signals are evaluated on confirmed bars and never change once printed. The adaptive thresholds move slowly as the history window rolls, but past signals are not re-evaluated.
Q: Does the ADX show direction?
A: The index itself does not — it measures strength only. Direction comes from the directional lines, which this tool reads for you as the Compass row, the aura color and the ribbon color.
Q: Why does the ribbon fade?
A: Its opacity is tied to strength. A faint ribbon is not a bug — it is the tool telling you the trend has no force behind it.
Q: What does "Late" mean in Trend Age?
A: The current trend has already lasted longer than this symbol's average trend. It is not a sell signal; it is a maturity reading that raises the value of the exhaustion signal when it comes.
Q: What do the family percentages mean?
A: The share of past signals in that family after which price had moved favorably ten bars later (for E, the share after which the trend stalled), on the current symbol and timeframe, shrunk toward fifty percent at small samples. They describe history — they are not predictions.
═══════════════════════════════════════════════
🔶 CREDITS
The Average Directional Index, the Directional Movement system and the Average True Range are by J. Welles Wilder Jr. (New Concepts in Technical Trading Systems, 1978). The Wilson score interval is by Edwin B. Wilson (1927). The adaptive strength ranking, trend-age model, signal families, per-symbol statistics, on-chart rendering and all code in this script are original work — no third-party or open-source script code was reused.
═══════════════════════════════════════════════
🔶 LIMITATIONS
— The index is a smoothed, lagging measure; adaptive ranking sharpens its reading but cannot remove the lag.
— Trend Age needs several completed trends on the chart before the average lifespan is meaningful.
— Statistics describe the current chart's history only; past frequencies never guarantee future outcomes.
═══════════════════════════════════════════════
🔶 DISCLAIMER
This indicator is a research and charting tool provided for educational purposes. It is not financial advice, and nothing it displays is a recommendation to buy or sell any asset. Trading involves substantial risk of loss. Always do your own analysis and manage risk responsibly.
Open-source script
In true TradingView spirit, the creator of this script has made it open-source, so that traders can review and verify its functionality. Kudos to the author! While you can use it for free, remember that republishing the code is subject to our House Rules.

The institutional Edge: Indicators, Strategies & a Free Academy. quantum-algo.com
All content provided by Quantum Algo is for informational & educational purposes only.
All content provided by Quantum Algo is for informational & educational purposes only.
Disclaimer
The information and publications are not meant to be, and do not constitute, financial, investment, trading, or other types of advice or recommendations supplied or endorsed by TradingView. Read more in the Terms of Use.
Open-source script
In true TradingView spirit, the creator of this script has made it open-source, so that traders can review and verify its functionality. Kudos to the author! While you can use it for free, remember that republishing the code is subject to our House Rules.
The institutional Edge: Indicators, Strategies & a Free Academy. quantum-algo.com
All content provided by Quantum Algo is for informational & educational purposes only.
All content provided by Quantum Algo is for informational & educational purposes only.
Disclaimer
The information and publications are not meant to be, and do not constitute, financial, investment, trading, or other types of advice or recommendations supplied or endorsed by TradingView. Read more in the Terms of Use.