Updated
Daily RSI Buy Score
OVERVIEW
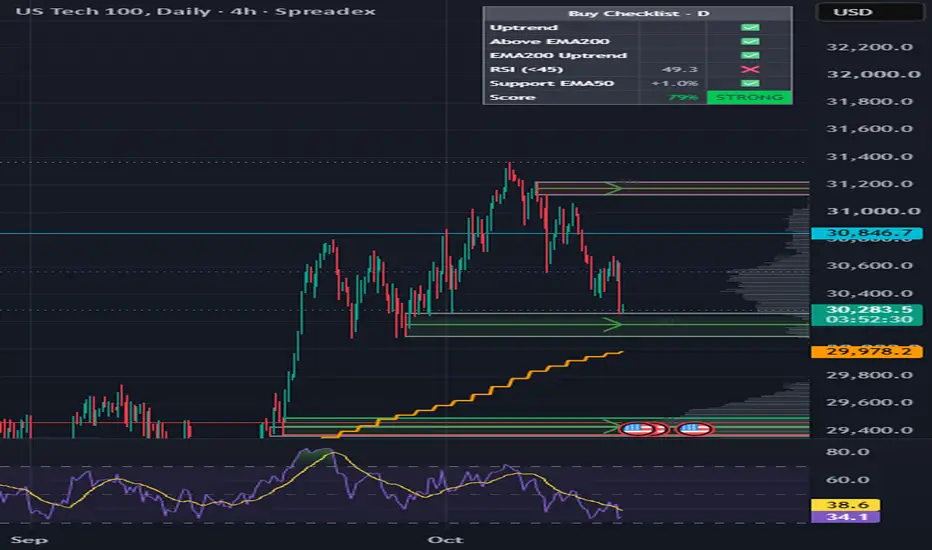
This indicator combines daily RSI, the daily 50 and 200 EMAs, and trend direction into a single checklist and a 0–100% "Buy Score". It is designed to help answer one question quickly: is price currently in a reasonable area to consider a buy, or is it stretched?
The RSI is shown in its own pane at the bottom. The checklist and score are displayed as a compact table on the price chart, and the daily EMAs are plotted directly on price.
All calculations use DAILY data by default, even on intraday charts. This lets you time entries on lower timeframes while keeping the daily picture in view.
WHAT'S ON THE CHART
• RSI pane – Daily RSI (14). The line turns green above the overbought level, red below the oversold level, and is purple in between.
• Daily EMA 50 (orange) and EMA 200 (blue) plotted on the price chart.
• Checklist table (top right by default):
– Uptrend: EMA 50 is above EMA 200
– Above EMA200: price is above the 200 EMA
– EMA200 Uptrend: the 200 EMA is rising (higher than it was 10 days ago)
– RSI (<45): daily RSI is below your buy-zone level
– EMA50 (±3%): price is within 3% of the 50 EMA
– EMA200 (±5%): price is within 5% of the 200 EMA
– Score: the overall Buy Score with a verdict label
HOW THE BUY SCORE IS CALCULATED
The score is a weighted average of four parts (weights are adjustable):
1. RSI (35%) – RSI at or below the oversold level (30) scores 100; RSI at or above the overbought level (70) scores 0; linear in between. Lower RSI = better entry.
2. Trend (25%) – EMA 50 above EMA 200 adds 50 points, price above EMA 200 adds 25, and a rising EMA 200 adds 25.
3. Proximity to EMA 50 (25%) – 100 when price is on the EMA, falling linearly to 0 at 10% away.
4. Proximity to EMA 200 (15%) – 100 when price is on the EMA, falling linearly to 0 at 20% away.
Verdicts:
• 75%+ STRONG
• 55%+ GOOD
• 40%+ NEUTRAL
• Below 40% WAIT
The idea: the best-scoring setups are pullbacks toward the moving averages in an established uptrend, with RSI cooled off, rather than chasing extended price with high RSI.
NEW TICKERS / LIMITED HISTORY
If a ticker doesn't have enough daily history for the 200 or 50 EMA, the script falls back to shorter EMAs (100 and 20 by default). Fallback EMAs are marked with an asterisk in the table (e.g. EMA100*). If even the fallback isn't available, those checks show ➖ and are excluded from the score, and the remaining weights are rescaled. Hover over the table title for a note when this happens. The fallback can be turned off in settings.
SETTINGS
• Analysis timeframe (default: Daily)
• RSI length, oversold / overbought levels, buy-zone level
• Fast / slow EMA lengths and fallback lengths
• "Near EMA" thresholds (0–10%)
• Distance at which proximity scores reach 0
• Score weights for each component
• Table position and text size
• Show/hide EMAs on the price chart
ALERTS
An alert condition is included for when the Buy Score crosses above a chosen level (default 75). Add it via the Alerts menu and select "Buy score high".
NOTES
• Values for the current day update in real time until the daily candle closes. Historical values do not change.
• The score measures how well the current price matches a "pullback in an uptrend" profile. It does not predict future price and does not consider fundamentals, news, volume, or market conditions.
• Default weights and thresholds are a starting point. Adjust them to fit your own style and the assets you trade.
DISCLAIMER
This script is for educational and informational purposes only and is not financial advice. Past behavior of any indicator does not guarantee future results. Always do your own research and manage your risk.
This indicator combines daily RSI, the daily 50 and 200 EMAs, and trend direction into a single checklist and a 0–100% "Buy Score". It is designed to help answer one question quickly: is price currently in a reasonable area to consider a buy, or is it stretched?
The RSI is shown in its own pane at the bottom. The checklist and score are displayed as a compact table on the price chart, and the daily EMAs are plotted directly on price.
All calculations use DAILY data by default, even on intraday charts. This lets you time entries on lower timeframes while keeping the daily picture in view.
WHAT'S ON THE CHART
• RSI pane – Daily RSI (14). The line turns green above the overbought level, red below the oversold level, and is purple in between.
• Daily EMA 50 (orange) and EMA 200 (blue) plotted on the price chart.
• Checklist table (top right by default):
– Uptrend: EMA 50 is above EMA 200
– Above EMA200: price is above the 200 EMA
– EMA200 Uptrend: the 200 EMA is rising (higher than it was 10 days ago)
– RSI (<45): daily RSI is below your buy-zone level
– EMA50 (±3%): price is within 3% of the 50 EMA
– EMA200 (±5%): price is within 5% of the 200 EMA
– Score: the overall Buy Score with a verdict label
HOW THE BUY SCORE IS CALCULATED
The score is a weighted average of four parts (weights are adjustable):
1. RSI (35%) – RSI at or below the oversold level (30) scores 100; RSI at or above the overbought level (70) scores 0; linear in between. Lower RSI = better entry.
2. Trend (25%) – EMA 50 above EMA 200 adds 50 points, price above EMA 200 adds 25, and a rising EMA 200 adds 25.
3. Proximity to EMA 50 (25%) – 100 when price is on the EMA, falling linearly to 0 at 10% away.
4. Proximity to EMA 200 (15%) – 100 when price is on the EMA, falling linearly to 0 at 20% away.
Verdicts:
• 75%+ STRONG
• 55%+ GOOD
• 40%+ NEUTRAL
• Below 40% WAIT
The idea: the best-scoring setups are pullbacks toward the moving averages in an established uptrend, with RSI cooled off, rather than chasing extended price with high RSI.
NEW TICKERS / LIMITED HISTORY
If a ticker doesn't have enough daily history for the 200 or 50 EMA, the script falls back to shorter EMAs (100 and 20 by default). Fallback EMAs are marked with an asterisk in the table (e.g. EMA100*). If even the fallback isn't available, those checks show ➖ and are excluded from the score, and the remaining weights are rescaled. Hover over the table title for a note when this happens. The fallback can be turned off in settings.
SETTINGS
• Analysis timeframe (default: Daily)
• RSI length, oversold / overbought levels, buy-zone level
• Fast / slow EMA lengths and fallback lengths
• "Near EMA" thresholds (0–10%)
• Distance at which proximity scores reach 0
• Score weights for each component
• Table position and text size
• Show/hide EMAs on the price chart
ALERTS
An alert condition is included for when the Buy Score crosses above a chosen level (default 75). Add it via the Alerts menu and select "Buy score high".
NOTES
• Values for the current day update in real time until the daily candle closes. Historical values do not change.
• The score measures how well the current price matches a "pullback in an uptrend" profile. It does not predict future price and does not consider fundamentals, news, volume, or market conditions.
• Default weights and thresholds are a starting point. Adjust them to fit your own style and the assets you trade.
DISCLAIMER
This script is for educational and informational purposes only and is not financial advice. Past behavior of any indicator does not guarantee future results. Always do your own research and manage your risk.
Release Notes
UPDATE: Smarter EMA support scoringWHAT CHANGED
• The two separate EMA proximity checks (EMA50 ±3% and EMA200 ±5%) have been replaced by a single "Support" check that identifies which EMA price is currently sitting on and shows the distance from it (e.g. "Support EMA200 +2.2%").
• Distance from an EMA is now scored differently above and below the line. Previously, price 3% below an EMA scored the same as price 3% above it. Now:
– Above the line: the score fades gradually as price gets extended (reaches 0 at +10%).
– Below the line: the score drops quickly (reaches 0 at −3%), so a breakdown is no longer rewarded like a pullback.
• Pullbacks to the EMA200 are now recognized. Each EMA is scored separately and the better score counts, so a pullback to the EMA200 in an uptrend scores well even when price is far below the EMA50.
• Price stuck between the two EMAs, far from both, now scores low since there is no nearby support.
• EMA200 pullbacks top out at 90 (instead of 100), reflecting the higher risk that the trend is failing.
• When the EMA50 is below the EMA200 (no uptrend), the support score is capped at 20.
• The Support checkmark requires an uptrend and price within the checkmark zone around the active line (default: 3% above / 1% below the EMA50, 5% above / 1.5% below the EMA200).
SCORE WEIGHTS
• RSI 35% (unchanged)
• Trend 25% (unchanged)
• Support 40% (replaces EMA50 proximity 25% + EMA200 proximity 15%)
NEW SETTINGS
• "EMA50 support" and "EMA200 support" groups: checkmark zone above/below the line (0–10%), and the distance above/below at which the score reaches 0
• Max support score at EMA200 (default 90)
• Support cap when the fast EMA is below the slow EMA (default 20)
NOTE
If you have alerts set up from a previous version, delete and recreate them so they use the updated logic.
Release Notes
RSI is now according to the timeframeRelease Notes
Fixed RSI
Disclaimer
The information and publications are not meant to be, and do not constitute, financial, investment, trading, or other types of advice or recommendations supplied or endorsed by TradingView. Read more in the Terms of Use.
Disclaimer
The information and publications are not meant to be, and do not constitute, financial, investment, trading, or other types of advice or recommendations supplied or endorsed by TradingView. Read more in the Terms of Use.