Market Internals Dashboard
Market Internals Dashboard
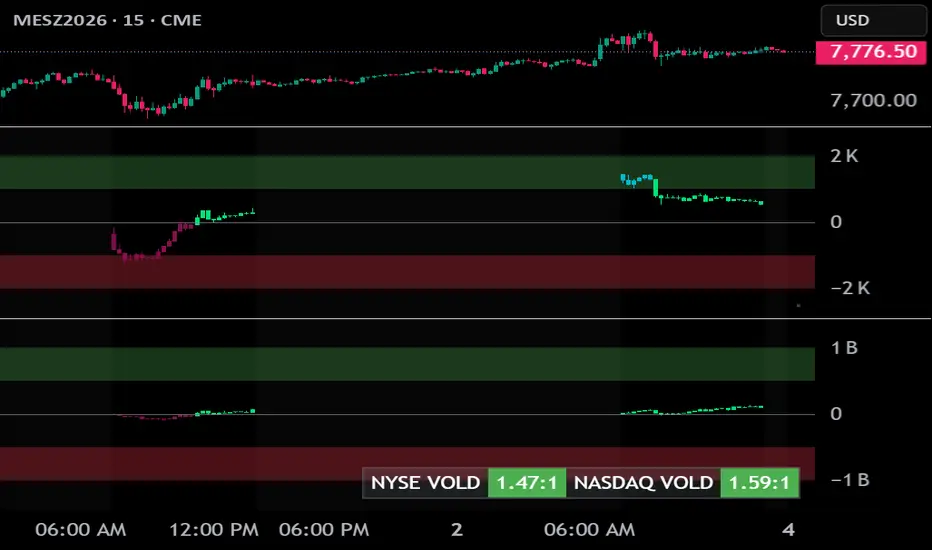
Market Internals Dashboard is a confirmation tool for monitoring TICK, ADD, and VOLD during the U.S. trading session. It is designed to help evaluate whether internal market participation supports or diverges from price action.
The indicator supports NYSE and NASDAQ internals and can be loaded multiple times to monitor different internals simultaneously.
Internals
TICK measures the number of stocks trading on an uptick versus a downtick. It is useful for evaluating short-term buying and selling pressure.
ADD represents advancing issues minus declining issues and provides a broader view of market breadth.
VOLD represents up volume minus down volume and provides information about the volume participation behind market direction.
When VOLD is selected, the dashboard also displays NYSE and NASDAQ Up/Down Volume ratios. Positive ratios indicate greater up-volume participation, while negative ratios indicate greater down-volume participation.
Display Modes
The selected internal can be displayed as:
- Candles
- Bars
- Columns
The indicator also supports Bar Value and Cumulative display modes.
Cumulative values reset at the beginning of the NY regular session.
Signal Zones
Default signal zones are based on the selected internal:
TICK
- Signal: ±600
- Strong: ±1000
ADD
- Signal: ±1000
- Strong: ±2000
VOLD
- Signal: ±500 million
- Strong: ±1 billion
These levels are intended as contextual references rather than standalone trade signals.
The signal-zone limits can be overridden through the indicator settings when different thresholds are preferred.
TICK Zero Cross
When enabled, confirmed TICK closes crossing the zero line are marked on the chart.
A bullish marker identifies a confirmed cross above zero, while a bearish marker identifies a confirmed cross below zero.
This provides a simple visual reference for changes in short-term internal pressure.
Internal Extreme Alerts
Alerts are available for confirmed threshold crosses during the NY regular session:
TICK: ±700
ADD: ±1500
The alert occurs on the first confirmed cross of the threshold, rather than continuously while the internal remains beyond it.
VOLD does not use an extreme alert because volume participation is additionally evaluated through the NYSE and NASDAQ Up/Down Volume ratios.
Custom Market-Internal Symbols
The default configuration uses TradingView's USI market-internal symbols for NYSE and NASDAQ data.
Symbol inputs are configurable so compatible alternative market-internal feeds can be substituted.
Alternative feeds may differ in:
- constituent universe
- calculation methodology
- session availability
- scaling
Therefore, the default signal and alert thresholds may require adjustment when alternative symbols are used.
Intended Use
This indicator is designed as a market-confirmation tool, not an entry system.
A typical workflow is to first identify important price structure or key levels, then use TICK, ADD, and VOLD to evaluate whether market participation confirms or diverges from the price move.
For example:
Price structure → acceptance/rejection → market-internal confirmation
Agreement between price and multiple internals can provide evidence of broader participation. Divergence can indicate that a price move lacks internal confirmation.
Notes
Market-internal data availability depends on the selected symbol and Trading View data feed. Missing or unavailable source data may result in gaps.
The default thresholds are reference levels and should not be interpreted as guaranteed reversal, continuation, or trade-entry signals.
Market Internals Dashboard is a confirmation tool for monitoring TICK, ADD, and VOLD during the U.S. trading session. It is designed to help evaluate whether internal market participation supports or diverges from price action.
The indicator supports NYSE and NASDAQ internals and can be loaded multiple times to monitor different internals simultaneously.
Internals
TICK measures the number of stocks trading on an uptick versus a downtick. It is useful for evaluating short-term buying and selling pressure.
ADD represents advancing issues minus declining issues and provides a broader view of market breadth.
VOLD represents up volume minus down volume and provides information about the volume participation behind market direction.
When VOLD is selected, the dashboard also displays NYSE and NASDAQ Up/Down Volume ratios. Positive ratios indicate greater up-volume participation, while negative ratios indicate greater down-volume participation.
Display Modes
The selected internal can be displayed as:
- Candles
- Bars
- Columns
The indicator also supports Bar Value and Cumulative display modes.
Cumulative values reset at the beginning of the NY regular session.
Signal Zones
Default signal zones are based on the selected internal:
TICK
- Signal: ±600
- Strong: ±1000
ADD
- Signal: ±1000
- Strong: ±2000
VOLD
- Signal: ±500 million
- Strong: ±1 billion
These levels are intended as contextual references rather than standalone trade signals.
The signal-zone limits can be overridden through the indicator settings when different thresholds are preferred.
TICK Zero Cross
When enabled, confirmed TICK closes crossing the zero line are marked on the chart.
A bullish marker identifies a confirmed cross above zero, while a bearish marker identifies a confirmed cross below zero.
This provides a simple visual reference for changes in short-term internal pressure.
Internal Extreme Alerts
Alerts are available for confirmed threshold crosses during the NY regular session:
TICK: ±700
ADD: ±1500
The alert occurs on the first confirmed cross of the threshold, rather than continuously while the internal remains beyond it.
VOLD does not use an extreme alert because volume participation is additionally evaluated through the NYSE and NASDAQ Up/Down Volume ratios.
Custom Market-Internal Symbols
The default configuration uses TradingView's USI market-internal symbols for NYSE and NASDAQ data.
Symbol inputs are configurable so compatible alternative market-internal feeds can be substituted.
Alternative feeds may differ in:
- constituent universe
- calculation methodology
- session availability
- scaling
Therefore, the default signal and alert thresholds may require adjustment when alternative symbols are used.
Intended Use
This indicator is designed as a market-confirmation tool, not an entry system.
A typical workflow is to first identify important price structure or key levels, then use TICK, ADD, and VOLD to evaluate whether market participation confirms or diverges from the price move.
For example:
Price structure → acceptance/rejection → market-internal confirmation
Agreement between price and multiple internals can provide evidence of broader participation. Divergence can indicate that a price move lacks internal confirmation.
Notes
Market-internal data availability depends on the selected symbol and Trading View data feed. Missing or unavailable source data may result in gaps.
The default thresholds are reference levels and should not be interpreted as guaranteed reversal, continuation, or trade-entry signals.

Disclaimer
The information and publications are not meant to be, and do not constitute, financial, investment, trading, or other types of advice or recommendations supplied or endorsed by TradingView. Read more in the Terms of Use.
Disclaimer
The information and publications are not meant to be, and do not constitute, financial, investment, trading, or other types of advice or recommendations supplied or endorsed by TradingView. Read more in the Terms of Use.