OPEN-SOURCE SCRIPT
Institutional Structure & Liquidity Flow Matrix [Pro V2]
Institutional Structure and Liquidity Flow Matrix [Pro V2]
Overview
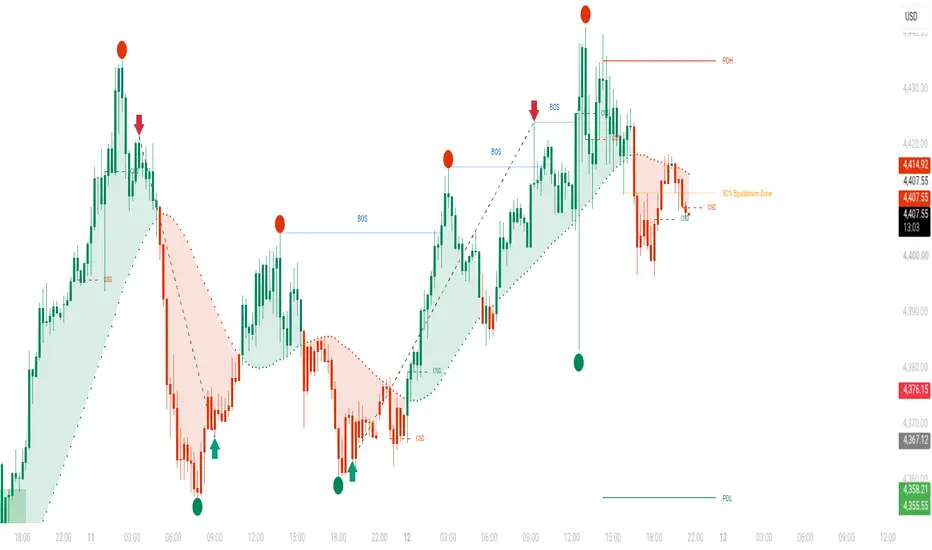
The Institutional Structure and Liquidity Flow Matrix [Pro V2] is an all-in-one market analysis tool designed for price-action and Smart Money Concepts (SMC) traders. It automates key institutional market structure elements on your chart including Break of Structure (BOS), Change of Character (CHoCH), Unmitigated Supply and Demand Zones, Change in State of Delivery (CISD) levels, and Daily Liquidity Markers (PDH/PDL) with visual dynamic candle color styling.
This script operates strictly on price action data calculated dynamically from the chart bars, offering clean visualization without overcrowding the trading interface.
Key Features and Visual Elements
1. Market Structure Engine (BOS and CHoCH)
- Break of Structure (BOS): Identifies trend continuation breaks where price closes beyond recent swing highs (bullish) or swing lows (bearish).
- Change of Character (CHoCH): Highlights early trend reversals when price breaks structure against the prevailing local trend direction.
- Precision Drawing: Lines dynamically extend strictly from the valid swing point to the exact bar where the structural break occurred, placing the indicator tag centered along the break.
2. Active Unmitigated Institutional Zones
- Dynamic Filtering: Identifies pivot-based Supply (Resistance) and Demand (Support) order blocks.
- Auto-Clearing Mechanism: To avoid chart clutter and outdated levels, any zone broken or mitigated by price action is automatically removed from the chart in real-time, displaying only active, actionable levels.
3. Change in State of Delivery (CISD)
- Tracks high-probability liquidity sweeps where a displacement candle penetrates liquidity pooled above or below key levels, followed immediately by a structural body closure in the opposite direction.
- Marks real-time CISD reference lines and labels.
4. Swing High / Low Markers (ITH / ITL)
- Marks key institutional intermediate or major high and low swing points with clean, non-intrusive color badges (Red dots for Swing Highs, Green dots for Swing Lows).
- Fully customizable lookback sensitivity.
5. Daily Liquidity References (PDH / PDL)
- Automatically plots the Previous Day High (PDH) and Previous Day Low (PDL) levels.
- Automatically hides or updates once a daily level is swept or invalidated by price action.
6. 50% Equilibrium Fib Zone
- Calculates the median (50%) equilibrium price level across a user-defined lookback period, allowing traders to evaluate Premium vs Discount price regions.
7. Aesthetic Dynamic Candle Glow and Trend Wave
- Colors candlestick bodies dynamically based on trend direction (Emerald Green for Bullish structure, Crimson Red for Bearish structure) for instant visual context.
Settings and Customization Guide
1. Market Structure Settings
- Show BOS and CHoCH Shifts: Toggle structure shift visibility ON or OFF.
- Pivot Lookback Sensitivity: Controls the swing detection sensitivity (Default is 5). Lower values catch minor structure; higher values isolate major market structure.
- Line Style and Colors: Fully customize line thickness and choose between Solid, Dashed, or Dotted line styles for BOS and CHoCH.
2. Unmitigated Zones Settings
- Show Active Support and Resistance Zones: Toggle Supply and Demand zone plotting.
- Zone Pivot Lookback: Set the lookback window used to identify order block origin bars.
- Zone Colors: Independent color and transparency controls for Demand (Support) and Supply (Resistance) boxes.
3. Major Swing Markers Settings
- Show Swing High and Low Markers: Enable or disable ITH and ITL markers.
- Major Pivot Sensitivity: Adjust sensitivity for detecting major structural swing points.
4. CISD Settings
- Show High Probability CISD Levels: Toggle Change in State of Delivery markers and dashed lines.
5. Previous Day High / Low (PDH and PDL) Settings
- Show Dynamic PDH and PDL: Toggle daily liquidity lines.
- Line Style and Thickness: Customize line appearance (Solid, Dashed, or Dotted).
6. Equilibrium Range Settings
- Equilibrium Lookback: Define the period length for calculating the 50% high-low range.
7. Glowing Candles and Trend Wave Settings
- Enable Dynamic Glowing Candles: Toggle chart candle body recoloring.
- Enable Wave Glow Line: Toggle trend wave line and soft background filling.
How to Use (Trading Application)
1. Identifying Bias: Observe the dynamic candle colors and Trend Wave orientation to determine directional momentum.
2. Structure Tracking: Look for BOS labels during trend continuation, and CHoCH labels during potential market reversals.
3. Key Execution Areas: Monitor active Unmitigated Support and Resistance zones for potential reaction points when aligned with the higher timeframe direction.
4. Liquidity Reference: Use PDH, PDL, and CISD lines to identify liquidity sweep zones and institutional delivery shifts.
Disclaimers and Things to Avoid
- No Financial Advice: This indicator is designed solely for technical analysis, chart visualization, and educational purposes. It does not provide buy or sell financial advice.
- Not a Standalone System: Technical analysis indicators should be used in conjunction with risk management, personal trading strategies, and multi-timeframe context.
- Avoid Over-Leverage: Past market behavior or structural shifts do not guarantee future price movements. Always apply strict risk management.
-
Overview
The Institutional Structure and Liquidity Flow Matrix [Pro V2] is an all-in-one market analysis tool designed for price-action and Smart Money Concepts (SMC) traders. It automates key institutional market structure elements on your chart including Break of Structure (BOS), Change of Character (CHoCH), Unmitigated Supply and Demand Zones, Change in State of Delivery (CISD) levels, and Daily Liquidity Markers (PDH/PDL) with visual dynamic candle color styling.
This script operates strictly on price action data calculated dynamically from the chart bars, offering clean visualization without overcrowding the trading interface.
Key Features and Visual Elements
1. Market Structure Engine (BOS and CHoCH)
- Break of Structure (BOS): Identifies trend continuation breaks where price closes beyond recent swing highs (bullish) or swing lows (bearish).
- Change of Character (CHoCH): Highlights early trend reversals when price breaks structure against the prevailing local trend direction.
- Precision Drawing: Lines dynamically extend strictly from the valid swing point to the exact bar where the structural break occurred, placing the indicator tag centered along the break.
2. Active Unmitigated Institutional Zones
- Dynamic Filtering: Identifies pivot-based Supply (Resistance) and Demand (Support) order blocks.
- Auto-Clearing Mechanism: To avoid chart clutter and outdated levels, any zone broken or mitigated by price action is automatically removed from the chart in real-time, displaying only active, actionable levels.
3. Change in State of Delivery (CISD)
- Tracks high-probability liquidity sweeps where a displacement candle penetrates liquidity pooled above or below key levels, followed immediately by a structural body closure in the opposite direction.
- Marks real-time CISD reference lines and labels.
4. Swing High / Low Markers (ITH / ITL)
- Marks key institutional intermediate or major high and low swing points with clean, non-intrusive color badges (Red dots for Swing Highs, Green dots for Swing Lows).
- Fully customizable lookback sensitivity.
5. Daily Liquidity References (PDH / PDL)
- Automatically plots the Previous Day High (PDH) and Previous Day Low (PDL) levels.
- Automatically hides or updates once a daily level is swept or invalidated by price action.
6. 50% Equilibrium Fib Zone
- Calculates the median (50%) equilibrium price level across a user-defined lookback period, allowing traders to evaluate Premium vs Discount price regions.
7. Aesthetic Dynamic Candle Glow and Trend Wave
- Colors candlestick bodies dynamically based on trend direction (Emerald Green for Bullish structure, Crimson Red for Bearish structure) for instant visual context.
Settings and Customization Guide
1. Market Structure Settings
- Show BOS and CHoCH Shifts: Toggle structure shift visibility ON or OFF.
- Pivot Lookback Sensitivity: Controls the swing detection sensitivity (Default is 5). Lower values catch minor structure; higher values isolate major market structure.
- Line Style and Colors: Fully customize line thickness and choose between Solid, Dashed, or Dotted line styles for BOS and CHoCH.
2. Unmitigated Zones Settings
- Show Active Support and Resistance Zones: Toggle Supply and Demand zone plotting.
- Zone Pivot Lookback: Set the lookback window used to identify order block origin bars.
- Zone Colors: Independent color and transparency controls for Demand (Support) and Supply (Resistance) boxes.
3. Major Swing Markers Settings
- Show Swing High and Low Markers: Enable or disable ITH and ITL markers.
- Major Pivot Sensitivity: Adjust sensitivity for detecting major structural swing points.
4. CISD Settings
- Show High Probability CISD Levels: Toggle Change in State of Delivery markers and dashed lines.
5. Previous Day High / Low (PDH and PDL) Settings
- Show Dynamic PDH and PDL: Toggle daily liquidity lines.
- Line Style and Thickness: Customize line appearance (Solid, Dashed, or Dotted).
6. Equilibrium Range Settings
- Equilibrium Lookback: Define the period length for calculating the 50% high-low range.
7. Glowing Candles and Trend Wave Settings
- Enable Dynamic Glowing Candles: Toggle chart candle body recoloring.
- Enable Wave Glow Line: Toggle trend wave line and soft background filling.
How to Use (Trading Application)
1. Identifying Bias: Observe the dynamic candle colors and Trend Wave orientation to determine directional momentum.
2. Structure Tracking: Look for BOS labels during trend continuation, and CHoCH labels during potential market reversals.
3. Key Execution Areas: Monitor active Unmitigated Support and Resistance zones for potential reaction points when aligned with the higher timeframe direction.
4. Liquidity Reference: Use PDH, PDL, and CISD lines to identify liquidity sweep zones and institutional delivery shifts.
Disclaimers and Things to Avoid
- No Financial Advice: This indicator is designed solely for technical analysis, chart visualization, and educational purposes. It does not provide buy or sell financial advice.
- Not a Standalone System: Technical analysis indicators should be used in conjunction with risk management, personal trading strategies, and multi-timeframe context.
- Avoid Over-Leverage: Past market behavior or structural shifts do not guarantee future price movements. Always apply strict risk management.
-
Open-source script
In true TradingView spirit, the creator of this script has made it open-source, so that traders can review and verify its functionality. Kudos to the author! While you can use it for free, remember that republishing the code is subject to our House Rules.

Follow The Trend Not The Crowd
Free Telegram Channel
t.me/+M7U84ec7_HYxMjU0
Free Telegram Channel
t.me/+M7U84ec7_HYxMjU0
Disclaimer
The information and publications are not meant to be, and do not constitute, financial, investment, trading, or other types of advice or recommendations supplied or endorsed by TradingView. Read more in the Terms of Use.
Open-source script
In true TradingView spirit, the creator of this script has made it open-source, so that traders can review and verify its functionality. Kudos to the author! While you can use it for free, remember that republishing the code is subject to our House Rules.
Follow The Trend Not The Crowd
Free Telegram Channel
t.me/+M7U84ec7_HYxMjU0
Free Telegram Channel
t.me/+M7U84ec7_HYxMjU0
Disclaimer
The information and publications are not meant to be, and do not constitute, financial, investment, trading, or other types of advice or recommendations supplied or endorsed by TradingView. Read more in the Terms of Use.