All-Time & YTD High/Low Levels with Proximity Alerts
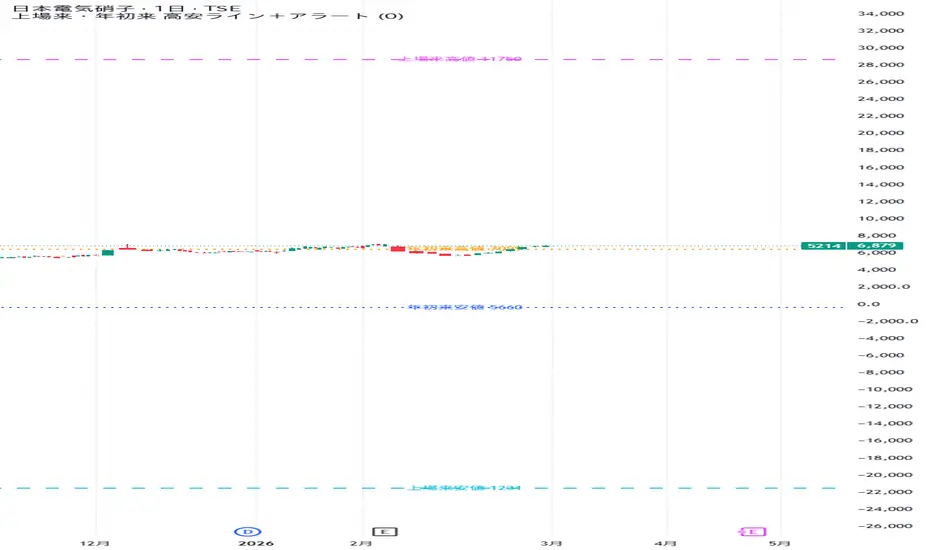
Overview:
This indicator automatically calculates and plots four of the most critical macro-level support and resistance zones directly onto your chart: All-Time High (ATH), All-Time Low (ATL), Year-To-Date High (YTD High), and Year-To-Date Low (YTD Low). Designed for both day traders and swing traders, it allows you to monitor these major historical levels on lower timeframes (e.g., 5m, 15m) without having to constantly switch to Monthly or Daily charts.
Key Features:
Custom Proximity Alerts: Never miss a historical breakout again! You can set a custom percentage threshold (e.g., 1.0%), and the indicator will trigger an alert exactly when the current price enters this "breakout watch zone" near any of the four levels.
Auto-Calculated Macro Levels: It seamlessly pulls higher timeframe data to ensure the ATH, ATL, and YTD levels remain accurate regardless of the intraday timeframe you are currently viewing.
Clean & Distinct Visuals: To keep your chart organized, ATH/ATL are plotted as dashed lines, while YTD levels are dotted. Each line features a clear, right-aligned label showing the specific price.
Fully Customizable: Through the intuitive settings menu, you can easily toggle each specific level ON/OFF and adjust their colors to perfectly match your personal chart theme.
(Note: The ATH/ATL calculation is based on the maximum available historical data loaded by TradingView for the selected ticker.)
【英文の簡単な和訳(確認用)】
概要: 上場来高値(ATH)・安値(ATL)、年初来高値(YTD High)・安値(YTD Low)という、マクロレベルで最も重要な4つのラインを自動描画するインジケーターです。下位足(5分足など)を見ながらでも、月足や日足に切り替えることなく歴史的なラインを監視できます。
特徴1(接近アラート機能): 歴史的なブレイクアウトを絶対に見逃しません!「1.0%」など任意の接近率を設定でき、価格がそのゾーンに突入した瞬間にアラートを発動させることができます。
特徴2(マクロレベルの自動計算): 上位足のデータを引っ張ってくるため、どの時間足を見ていても正確なラインが表示されます。
特徴3(スッキリとした見栄え): 上場来は破線、年初来は点線で表示し、右側には価格付きの分かりやすいラベルが表示されます。
特徴4(フルカスタマイズ): 設定画面から各ラインのON/OFFや色を自由に変更可能です。
(※注意書き: 上場来ラインは、TradingViewが読み込んでいる最大期間のデータに基づきますと添えています)
This indicator automatically calculates and plots four of the most critical macro-level support and resistance zones directly onto your chart: All-Time High (ATH), All-Time Low (ATL), Year-To-Date High (YTD High), and Year-To-Date Low (YTD Low). Designed for both day traders and swing traders, it allows you to monitor these major historical levels on lower timeframes (e.g., 5m, 15m) without having to constantly switch to Monthly or Daily charts.
Key Features:
Custom Proximity Alerts: Never miss a historical breakout again! You can set a custom percentage threshold (e.g., 1.0%), and the indicator will trigger an alert exactly when the current price enters this "breakout watch zone" near any of the four levels.
Auto-Calculated Macro Levels: It seamlessly pulls higher timeframe data to ensure the ATH, ATL, and YTD levels remain accurate regardless of the intraday timeframe you are currently viewing.
Clean & Distinct Visuals: To keep your chart organized, ATH/ATL are plotted as dashed lines, while YTD levels are dotted. Each line features a clear, right-aligned label showing the specific price.
Fully Customizable: Through the intuitive settings menu, you can easily toggle each specific level ON/OFF and adjust their colors to perfectly match your personal chart theme.
(Note: The ATH/ATL calculation is based on the maximum available historical data loaded by TradingView for the selected ticker.)
【英文の簡単な和訳(確認用)】
概要: 上場来高値(ATH)・安値(ATL)、年初来高値(YTD High)・安値(YTD Low)という、マクロレベルで最も重要な4つのラインを自動描画するインジケーターです。下位足(5分足など)を見ながらでも、月足や日足に切り替えることなく歴史的なラインを監視できます。
特徴1(接近アラート機能): 歴史的なブレイクアウトを絶対に見逃しません!「1.0%」など任意の接近率を設定でき、価格がそのゾーンに突入した瞬間にアラートを発動させることができます。
特徴2(マクロレベルの自動計算): 上位足のデータを引っ張ってくるため、どの時間足を見ていても正確なラインが表示されます。
特徴3(スッキリとした見栄え): 上場来は破線、年初来は点線で表示し、右側には価格付きの分かりやすいラベルが表示されます。
特徴4(フルカスタマイズ): 設定画面から各ラインのON/OFFや色を自由に変更可能です。
(※注意書き: 上場来ラインは、TradingViewが読み込んでいる最大期間のデータに基づきますと添えています)

Disclaimer
The information and publications are not meant to be, and do not constitute, financial, investment, trading, or other types of advice or recommendations supplied or endorsed by TradingView. Read more in the Terms of Use.
Disclaimer
The information and publications are not meant to be, and do not constitute, financial, investment, trading, or other types of advice or recommendations supplied or endorsed by TradingView. Read more in the Terms of Use.