Updated
ETH HOD/LOD VWAP
Written for: TradingView users reading the indicator's description.
ETH HOD/LOD VWAP
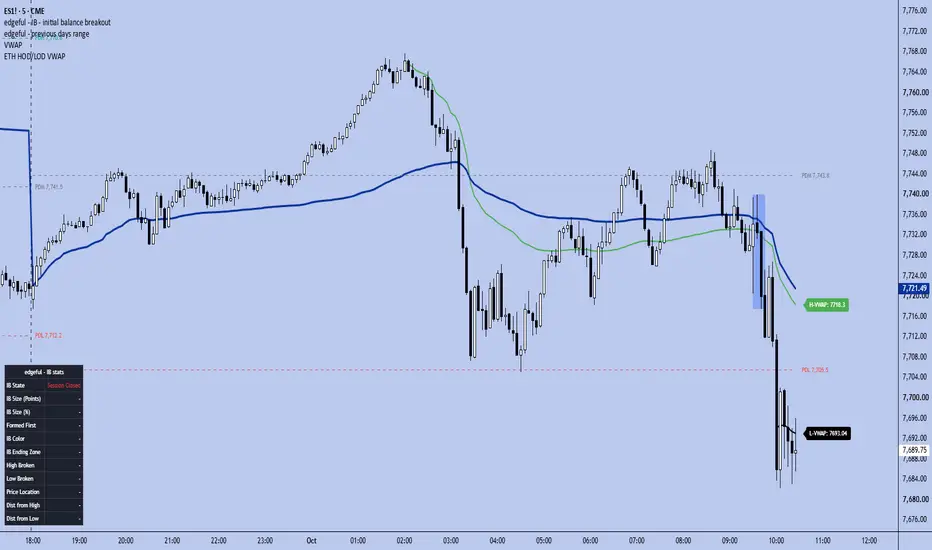
This indicator draws two anchored VWAPs: one from the high of day and one from the low of day of the full Globex (ETH) session, 18:00–17:00 New York time.
When price makes a new session high, the H-VWAP (red) re-anchors to that bar and builds its VWAP from there. The L-VWAP (cyan) does the same from each new session low. Both reset at the start of every new ETH session, including the Sunday open.
The two lines show the volume-weighted average price of everyone who has traded since the current extreme. That makes them useful as dynamic support and resistance, and for judging whether buyers or sellers are in control after the high or low is set.
Notes
Turn on Extended Trading Hours on your chart, or the overnight highs and lows will be missed.
Built for CME futures (NQ, ES, etc.). Works on any intraday timeframe.
You can change the line colors, line thickness and label offset.
ETH HOD/LOD VWAP
This indicator draws two anchored VWAPs: one from the high of day and one from the low of day of the full Globex (ETH) session, 18:00–17:00 New York time.
When price makes a new session high, the H-VWAP (red) re-anchors to that bar and builds its VWAP from there. The L-VWAP (cyan) does the same from each new session low. Both reset at the start of every new ETH session, including the Sunday open.
The two lines show the volume-weighted average price of everyone who has traded since the current extreme. That makes them useful as dynamic support and resistance, and for judging whether buyers or sellers are in control after the high or low is set.
Notes
Turn on Extended Trading Hours on your chart, or the overnight highs and lows will be missed.
Built for CME futures (NQ, ES, etc.). Works on any intraday timeframe.
You can change the line colors, line thickness and label offset.
Release Notes
Written for: TradingView users reading the indicator's description.ETH HOD/LOD VWAP
This indicator draws two anchored VWAPs, one from the high of day and one from the low of day of the full Globex (ETH) session, 18:00–17:00 New York time.
By default, the HOD and LOD are set by candle closes, not wicks. The H-VWAP anchors to the candle with the highest close of the session, and the L-VWAP anchors to the candle with the lowest close. Whenever a candle closes beyond the current extreme, that line moves to the new candle. Both lines reset at the start of each new ETH session, including the Sunday open.
The two lines show the average price paid by everyone who has traded since the session's extreme close. You can use them as dynamic support and resistance, or to judge whether buyers or sellers are in control after the high or low forms.
Notes
Use the Anchor On setting to switch between Close (default) and Wick (true high/low).
Turn on Extended Trading Hours on your chart, or the overnight extremes will be missed.
Built for CME futures (NQ, ES, etc.) and works on any intraday timeframe. The anchor candle depends on the chart timeframe.
You can change the line colours, line thickness and label offset.

Disclaimer
The information and publications are not meant to be, and do not constitute, financial, investment, trading, or other types of advice or recommendations supplied or endorsed by TradingView. Read more in the Terms of Use.
Disclaimer
The information and publications are not meant to be, and do not constitute, financial, investment, trading, or other types of advice or recommendations supplied or endorsed by TradingView. Read more in the Terms of Use.