Pressure Flow Pro [Thomas]
Introduction
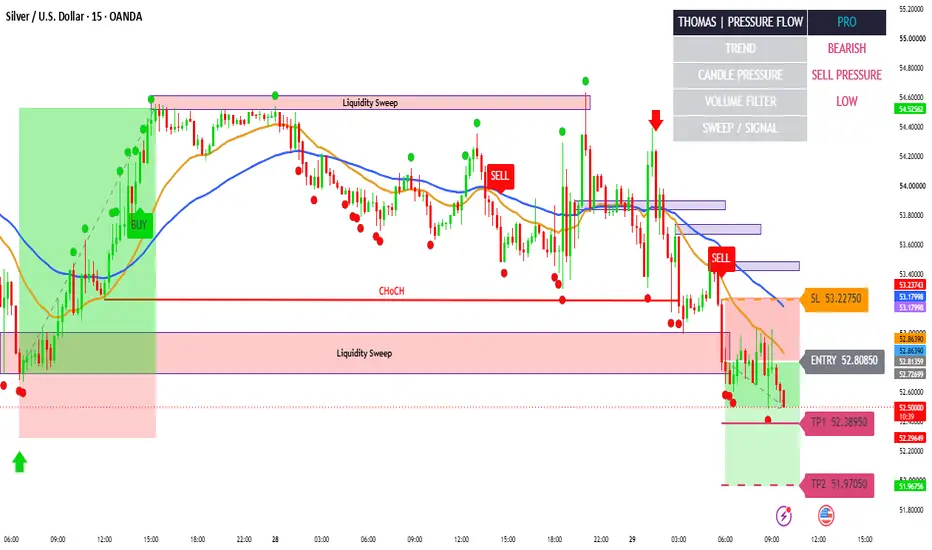
Pressure Flow Pro [Thomas] is a technical analysis indicator designed to help traders evaluate market direction, candle strength, relative volume, and potential liquidity events through a structured chart layout.
The indicator combines EMA-based trend analysis, price-action conditions, liquidity sweep detection, and relative volume filtering to identify potential trading setups.
Rather than relying on a single market signal, the system evaluates multiple conditions before displaying a BUY or SELL setup. It also provides calculated Entry, Stop Loss, and Take Profit levels to help traders organize their analysis.
1. Trend Analysis System
The indicator uses two Exponential Moving Averages (EMAs) to assess the current market direction.
- Fast EMA: Default 21-period EMA.
- Slow EMA: Default 50-period EMA.
Bullish Conditions: The fast EMA is above the slow EMA, and price is trading above the fast EMA.
Bearish Conditions: The fast EMA is below the slow EMA, and price is trading below the fast EMA.
These conditions help identify directional market bias. They do not independently confirm a future price movement.

2. Liquidity Sweep Detection
The indicator examines recent highs and lows to identify potential liquidity sweep events.
Low-Side Sweep: Price moves below the previous lookback low and closes back above that level.
High-Side Sweep: Price moves above the previous lookback high and closes back below that level.
Small chart markers highlight these events, helping traders observe possible rejection areas and evaluate price behavior around previous extremes.
A liquidity sweep is not automatically a reversal signal. Further price-action confirmation may be necessary.
3. Candle Pressure Analysis
The system evaluates candle direction and the proportion of the candle's range occupied by its body.
- Bullish Pressure: A bullish candle meets the minimum body-ratio requirement.
- Bearish Pressure: A bearish candle meets the minimum body-ratio requirement.
- Balanced: Neither directional candle condition is satisfied.
The default minimum candle body ratio is 0.45, meaning the candle body must account for at least 45% of its high-low range.
This is a candle-strength filter, not a direct measurement of buying or selling order flow.
4. Relative Volume Filter
The indicator compares current volume with its moving average to evaluate relative market activity.
Default settings:
- Volume Average Length: 20 bars.
- Relative Volume Filter: 1.0 times average volume.
When volume data is unavailable, the script permits the volume condition to pass. Traders should therefore verify whether reliable volume data is available for their selected symbol.

5. BUY and SELL Setup Logic
Potential BUY Setup
A BUY signal can appear when:
- Price breaks above the recent lookback high or produces a low-side liquidity sweep.
- The EMA conditions indicate a bullish trend.
- The candle meets the bullish pressure requirement.
- The relative volume condition passes.
- The signal cooldown condition is satisfied.
Potential SELL Setup
A SELL signal can appear when:
- Price breaks below the recent lookback low or produces a high-side liquidity sweep.
- The EMA conditions indicate a bearish trend.
- The candle meets the bearish pressure requirement.
- The relative volume condition passes.
- The signal cooldown condition is satisfied.
Signals are evaluated on confirmed candle closes to reduce intrabar signal changes. However, this does not eliminate every form of repainting or guarantee successful trades.
6. Entry, Stop Loss & Take Profit
When a qualifying signal appears, the indicator calculates and plots the following levels:
- ENTRY: The closing price of the signal candle.
- SL: A volatility-based reference level using the signal candle and ATR.
- TP1: The first calculated risk-to-reward target.
- TP2: The second calculated risk-to-reward target.
Default risk-to-reward settings:
- TP1: 1R
- TP2: 2R
- ATR Length: 14
- ATR Stop Multiplier: 1.2
The levels are calculated from the indicator's predefined rules. They are reference levels, not guaranteed execution prices. Slippage, spreads, gaps, and changing market conditions can affect actual trade outcomes.

7. Live Dashboard
The dashboard provides a compact overview of the indicator's current conditions:
- Trend: Bullish, bearish, or neutral.
- Candle Pressure: Buy pressure, sell pressure, or balanced.
- Volume Filter: Pass or low.
- Liquidity Sweep: Recent low-side or high-side sweep status.
- Signal Status: BUY, SELL, or WAIT.
The dashboard is intended to support faster chart reading and does not replace independent market analysis.
8. Customization Settings
Traders can adjust the indicator using the available inputs:
- Fast EMA: 21
- Slow EMA: 50
- Liquidity Lookback: 20
- Volume Average: 20
- Relative Volume Filter: 1.0
- ATR Length: 14
- Minimum Candle Body Ratio: 0.45
- Signal Cooldown: 8 bars
- TP1 Risk-to-Reward: 1.0R
- TP2 Risk-to-Reward: 2.0R
- Level Label Distance: 20 bars
The indicator also provides options to show or hide the EMAs, liquidity sweep markers, and dashboard.
These are default settings, not universally optimal parameters. Different markets and timeframes may require different configurations.
9. TradingView Alerts
The script includes alert conditions for:
- Pressure Flow BUY
- Pressure Flow SELL
- Low Liquidity Sweep
- High Liquidity Sweep
To use them, add the indicator to your chart, open TradingView's alert creation panel, and select the desired condition.
Alerts notify traders when defined conditions occur. They do not execute trades or guarantee that a setup will remain valid.
10. Intended Use
Pressure Flow Pro [Thomas] can be used as a technical analysis aid for markets such as Gold and BTCUSD, provided the selected symbol has suitable data.
Traders may evaluate the indicator on different timeframes, beginning with their preferred timeframe and testing the settings against the market's characteristics.
For best analytical practice, consider the broader trend, nearby support and resistance, major economic events, and appropriate risk management before acting on a signal.
Important Risk Disclosure
This indicator is provided for educational and analytical purposes only. It is not financial advice or a recommendation to buy or sell any financial instrument.
No indicator can guarantee profitable results or predict every market movement. Past performance does not guarantee future results. Always perform independent research, test the script before live use, and never risk money you cannot afford to lose.
Pressure Flow Pro [Thomas] is a technical analysis indicator designed to help traders evaluate market direction, candle strength, relative volume, and potential liquidity events through a structured chart layout.
The indicator combines EMA-based trend analysis, price-action conditions, liquidity sweep detection, and relative volume filtering to identify potential trading setups.
Rather than relying on a single market signal, the system evaluates multiple conditions before displaying a BUY or SELL setup. It also provides calculated Entry, Stop Loss, and Take Profit levels to help traders organize their analysis.
1. Trend Analysis System
The indicator uses two Exponential Moving Averages (EMAs) to assess the current market direction.
- Fast EMA: Default 21-period EMA.
- Slow EMA: Default 50-period EMA.
Bullish Conditions: The fast EMA is above the slow EMA, and price is trading above the fast EMA.
Bearish Conditions: The fast EMA is below the slow EMA, and price is trading below the fast EMA.
These conditions help identify directional market bias. They do not independently confirm a future price movement.
2. Liquidity Sweep Detection
The indicator examines recent highs and lows to identify potential liquidity sweep events.
Low-Side Sweep: Price moves below the previous lookback low and closes back above that level.
High-Side Sweep: Price moves above the previous lookback high and closes back below that level.
Small chart markers highlight these events, helping traders observe possible rejection areas and evaluate price behavior around previous extremes.
A liquidity sweep is not automatically a reversal signal. Further price-action confirmation may be necessary.
3. Candle Pressure Analysis
The system evaluates candle direction and the proportion of the candle's range occupied by its body.
- Bullish Pressure: A bullish candle meets the minimum body-ratio requirement.
- Bearish Pressure: A bearish candle meets the minimum body-ratio requirement.
- Balanced: Neither directional candle condition is satisfied.
The default minimum candle body ratio is 0.45, meaning the candle body must account for at least 45% of its high-low range.
This is a candle-strength filter, not a direct measurement of buying or selling order flow.
4. Relative Volume Filter
The indicator compares current volume with its moving average to evaluate relative market activity.
Default settings:
- Volume Average Length: 20 bars.
- Relative Volume Filter: 1.0 times average volume.
When volume data is unavailable, the script permits the volume condition to pass. Traders should therefore verify whether reliable volume data is available for their selected symbol.
5. BUY and SELL Setup Logic
Potential BUY Setup
A BUY signal can appear when:
- Price breaks above the recent lookback high or produces a low-side liquidity sweep.
- The EMA conditions indicate a bullish trend.
- The candle meets the bullish pressure requirement.
- The relative volume condition passes.
- The signal cooldown condition is satisfied.
Potential SELL Setup
A SELL signal can appear when:
- Price breaks below the recent lookback low or produces a high-side liquidity sweep.
- The EMA conditions indicate a bearish trend.
- The candle meets the bearish pressure requirement.
- The relative volume condition passes.
- The signal cooldown condition is satisfied.
Signals are evaluated on confirmed candle closes to reduce intrabar signal changes. However, this does not eliminate every form of repainting or guarantee successful trades.
6. Entry, Stop Loss & Take Profit
When a qualifying signal appears, the indicator calculates and plots the following levels:
- ENTRY: The closing price of the signal candle.
- SL: A volatility-based reference level using the signal candle and ATR.
- TP1: The first calculated risk-to-reward target.
- TP2: The second calculated risk-to-reward target.
Default risk-to-reward settings:
- TP1: 1R
- TP2: 2R
- ATR Length: 14
- ATR Stop Multiplier: 1.2
The levels are calculated from the indicator's predefined rules. They are reference levels, not guaranteed execution prices. Slippage, spreads, gaps, and changing market conditions can affect actual trade outcomes.
7. Live Dashboard
The dashboard provides a compact overview of the indicator's current conditions:
- Trend: Bullish, bearish, or neutral.
- Candle Pressure: Buy pressure, sell pressure, or balanced.
- Volume Filter: Pass or low.
- Liquidity Sweep: Recent low-side or high-side sweep status.
- Signal Status: BUY, SELL, or WAIT.
The dashboard is intended to support faster chart reading and does not replace independent market analysis.
8. Customization Settings
Traders can adjust the indicator using the available inputs:
- Fast EMA: 21
- Slow EMA: 50
- Liquidity Lookback: 20
- Volume Average: 20
- Relative Volume Filter: 1.0
- ATR Length: 14
- Minimum Candle Body Ratio: 0.45
- Signal Cooldown: 8 bars
- TP1 Risk-to-Reward: 1.0R
- TP2 Risk-to-Reward: 2.0R
- Level Label Distance: 20 bars
The indicator also provides options to show or hide the EMAs, liquidity sweep markers, and dashboard.
These are default settings, not universally optimal parameters. Different markets and timeframes may require different configurations.
9. TradingView Alerts
The script includes alert conditions for:
- Pressure Flow BUY
- Pressure Flow SELL
- Low Liquidity Sweep
- High Liquidity Sweep
To use them, add the indicator to your chart, open TradingView's alert creation panel, and select the desired condition.
Alerts notify traders when defined conditions occur. They do not execute trades or guarantee that a setup will remain valid.
10. Intended Use
Pressure Flow Pro [Thomas] can be used as a technical analysis aid for markets such as Gold and BTCUSD, provided the selected symbol has suitable data.
Traders may evaluate the indicator on different timeframes, beginning with their preferred timeframe and testing the settings against the market's characteristics.
For best analytical practice, consider the broader trend, nearby support and resistance, major economic events, and appropriate risk management before acting on a signal.
Important Risk Disclosure
This indicator is provided for educational and analytical purposes only. It is not financial advice or a recommendation to buy or sell any financial instrument.
No indicator can guarantee profitable results or predict every market movement. Past performance does not guarantee future results. Always perform independent research, test the script before live use, and never risk money you cannot afford to lose.

Join telegram for free gold btcusd and usoil signals
t.me/+viyq6E0EBl82MmY8
t.me/+viyq6E0EBl82MmY8
Disclaimer
The information and publications are not meant to be, and do not constitute, financial, investment, trading, or other types of advice or recommendations supplied or endorsed by TradingView. Read more in the Terms of Use.
Join telegram for free gold btcusd and usoil signals
t.me/+viyq6E0EBl82MmY8
t.me/+viyq6E0EBl82MmY8
Disclaimer
The information and publications are not meant to be, and do not constitute, financial, investment, trading, or other types of advice or recommendations supplied or endorsed by TradingView. Read more in the Terms of Use.