OPEN-SOURCE SCRIPT
TRDR Zone Multi-Session ORB
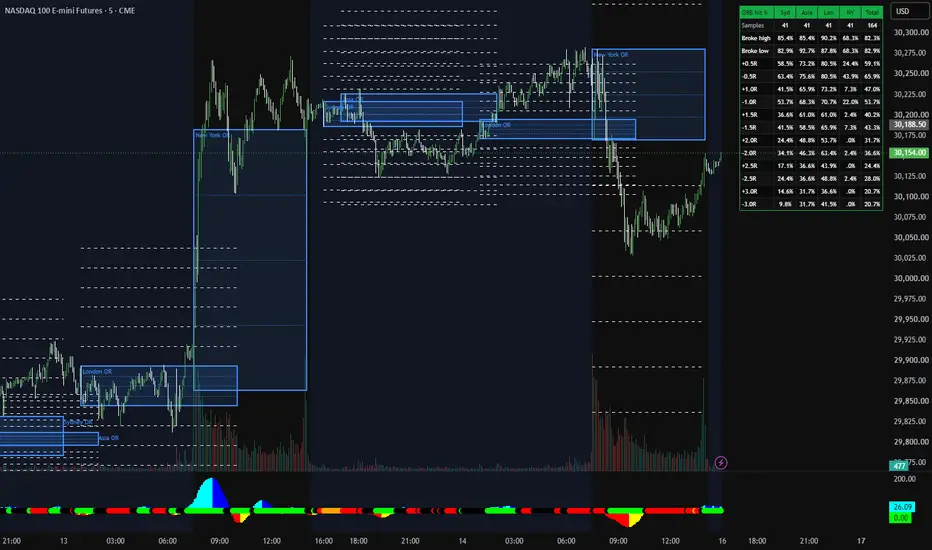
This indicator maps the opening range for every major session on the same chart, then tells you how often price actually followed through after that range locked.
WHAT IT DOES
Each enabled session builds an opening range from its first N minutes. Once that window closes, the range is locked and projected through the rest of the session.
You get:
A filled range box (one color)
Dotted lines at 25%, 50%, and 75% of the range
Dashed targets at 0.5, 1.0, 1.5, 2.0, 2.5, and 3.0 times the range, above and below
A stats table showing how often, after the range formed, price broke the high, broke the low, or reached each target
Sessions can overlap. That is intentional. London and New York do not take turns. When they stack, both ranges stay on the chart.
SESSIONS (New York time, all adjustable)
Sydney: 17:00–02:00
Asia: 19:00–04:00
London: 03:00–12:00
New York: 09:30–16:00
Overnight / ETH: 18:00–09:30 (off by default)
Custom session (off by default)
Toggle any session on or off. Change its clock. Change its opening-range length independently. Leave "Include Sunday" on for futures. Turn it off for cash symbols.
HOW TO READ IT
The box is the range. If price is still inside it, the session has not chosen a side yet.
The dotted lines are location, not signals. Mid-range is balance. 25% and 75% show you whether a "break" is a real expansion or just a probe.
The dashed lines are measured move targets. They are not take-profit commands. They are a map of how far this session's range usually travels when it does travel.
The stats table is the filter. If a session rarely reaches +2R, stop trading it like it does. Process over hope.
STATS (read them correctly)
Numbers are session hit rates, not time-in-market.
After the opening range locks, the rest of that session is scored:
Broke high / broke low: price traded strictly through the OR extreme
Target hit: price reached that level or beyond
Samples: how many completed sessions were counted
Total: all enabled sessions combined
Unfinished sessions are not counted. A range that never had time to lock is not counted. Set lookback days to 0 to use all available history.
BEST USE
1, 3, 5, or 15 minute charts
Futures (ES, NQ, CL, GC) and FX
If your chart bar is longer than the OR window, the first session bar becomes the range
Turn off sessions you do not trade. Turn off targets you do not use. If the chart gets noisy, hide labels and drop "Sessions to draw."
THIS IS NOT
A buy/sell signal. A strategy. A promise that the next range will break.
It is a repeatable map of session structure and a record of what price has actually done after that structure formed.
If you cannot explain why you are fading or following a range, you are guessing. This gives you the levels. The journal still has to do the rest.
Trade with discipline. Learn with purpose. Build with systems.
WHAT IT DOES
Each enabled session builds an opening range from its first N minutes. Once that window closes, the range is locked and projected through the rest of the session.
You get:
A filled range box (one color)
Dotted lines at 25%, 50%, and 75% of the range
Dashed targets at 0.5, 1.0, 1.5, 2.0, 2.5, and 3.0 times the range, above and below
A stats table showing how often, after the range formed, price broke the high, broke the low, or reached each target
Sessions can overlap. That is intentional. London and New York do not take turns. When they stack, both ranges stay on the chart.
SESSIONS (New York time, all adjustable)
Sydney: 17:00–02:00
Asia: 19:00–04:00
London: 03:00–12:00
New York: 09:30–16:00
Overnight / ETH: 18:00–09:30 (off by default)
Custom session (off by default)
Toggle any session on or off. Change its clock. Change its opening-range length independently. Leave "Include Sunday" on for futures. Turn it off for cash symbols.
HOW TO READ IT
The box is the range. If price is still inside it, the session has not chosen a side yet.
The dotted lines are location, not signals. Mid-range is balance. 25% and 75% show you whether a "break" is a real expansion or just a probe.
The dashed lines are measured move targets. They are not take-profit commands. They are a map of how far this session's range usually travels when it does travel.
The stats table is the filter. If a session rarely reaches +2R, stop trading it like it does. Process over hope.
STATS (read them correctly)
Numbers are session hit rates, not time-in-market.
After the opening range locks, the rest of that session is scored:
Broke high / broke low: price traded strictly through the OR extreme
Target hit: price reached that level or beyond
Samples: how many completed sessions were counted
Total: all enabled sessions combined
Unfinished sessions are not counted. A range that never had time to lock is not counted. Set lookback days to 0 to use all available history.
BEST USE
1, 3, 5, or 15 minute charts
Futures (ES, NQ, CL, GC) and FX
If your chart bar is longer than the OR window, the first session bar becomes the range
Turn off sessions you do not trade. Turn off targets you do not use. If the chart gets noisy, hide labels and drop "Sessions to draw."
THIS IS NOT
A buy/sell signal. A strategy. A promise that the next range will break.
It is a repeatable map of session structure and a record of what price has actually done after that structure formed.
If you cannot explain why you are fading or following a range, you are guessing. This gives you the levels. The journal still has to do the rest.
Trade with discipline. Learn with purpose. Build with systems.
Open-source script
In true TradingView spirit, the creator of this script has made it open-source, so that traders can review and verify its functionality. Kudos to the author! While you can use it for free, remember that republishing the code is subject to our House Rules.

Disclaimer
The information and publications are not meant to be, and do not constitute, financial, investment, trading, or other types of advice or recommendations supplied or endorsed by TradingView. Read more in the Terms of Use.
Open-source script
In true TradingView spirit, the creator of this script has made it open-source, so that traders can review and verify its functionality. Kudos to the author! While you can use it for free, remember that republishing the code is subject to our House Rules.
Disclaimer
The information and publications are not meant to be, and do not constitute, financial, investment, trading, or other types of advice or recommendations supplied or endorsed by TradingView. Read more in the Terms of Use.