SUPER INDIBOT - EMA Ribbon Trend
OVERVIEW
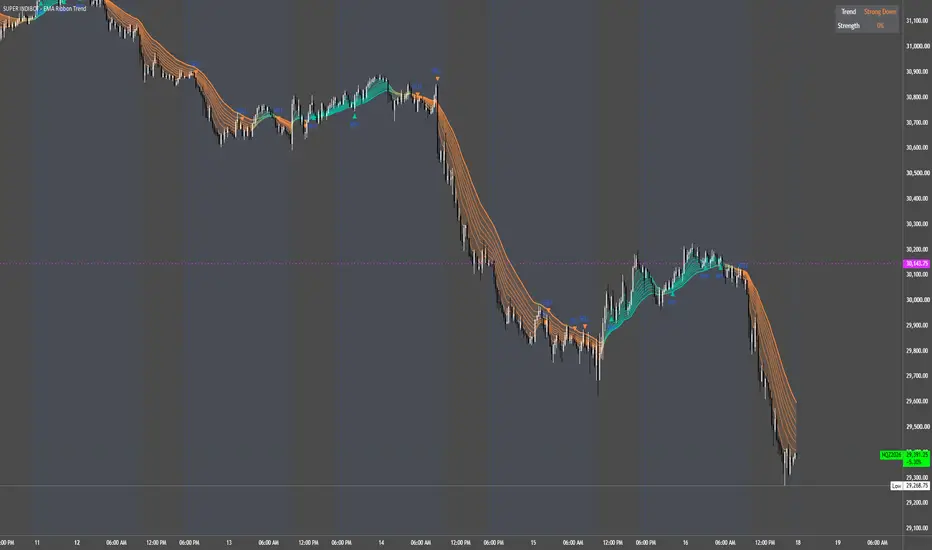
SUPER INDIBOT is an eight-EMA ribbon that visualizes moving-average alignment through a color gradient, trend-transition markers, and a compact status table.
The indicator helps users distinguish fully ordered EMA structures from partially aligned conditions. It uses standard exponential moving averages and adjacent-pair comparisons, not machine learning or automated trade execution.
EIGHT-EMA RIBBON
The ribbon calculates eight EMAs from closing prices.
Default lengths:
All lengths are adjustable. To preserve the intended short-to-long interpretation, keep them in ascending order.
The script compares the EMAs in their input order; it does not automatically sort custom lengths.
A shaded fill connects the first and eighth EMAs, while the eighth EMA uses a thicker line to help identify the ribbon’s longer-period boundary.
ALIGNMENT CALCULATION
The system evaluates seven adjacent EMA pairs:
EMA 1 versus EMA 2, EMA 2 versus EMA 3, and so on through EMA 7 versus EMA 8.
Each comparison contributes one point when the earlier EMA is strictly above the next EMA.
Displayed percentage = Bullish pair count ÷ 7 × 100
Examples:
The percentage measures bullish alignment—not trend quality, confidence, or probability of success.
A reading of 0% is the bearish end of the scale, not an absence of directional alignment. Equal EMA values also contribute zero, so 0% does not strictly guarantee that every pair is bearish.
RIBBON COLORS
The ribbon uses a continuous gradient between the selected bearish and bullish colors.
The gradient reflects how many adjacent comparisons are bullish. It does not measure EMA separation, slope, trading volume, volatility, or price momentum.
The “Neutral color” input is present in this version but is not used by the ribbon, signals, or table.
TREND STATUS TABLE
The optional table appears in the upper-right corner and displays the trend classification and alignment percentage.
Classifications:
“Strong” describes the completeness of the EMA ordering, not a verified measure of trend strength or expected returns.
The code includes a “Mixed” classification for an exact 50% reading. However, seven binary comparisons cannot produce exactly 50%, so this classification is not normally displayed.
BUY AND SELL MARKERS
Markers appear when the relevant full-alignment state begins, not on every bar while it persists.
A signal does not require a complete reversal from the opposite trend. If the ribbon leaves full alignment and later returns to the same full-alignment state, another marker can appear.
These labels identify alignment transitions. They are not order instructions and do not include stop-loss levels, profit targets, or position sizing.
ALERTS
The indicator provides two alert conditions:
Turning off “Show trend-flip signals” hides the chart markers but does not disable the alert conditions.
For close-based notifications, select “Once Per Bar Close” when creating an alert.
SUGGESTED WORKFLOW
The indicator operates on the current chart timeframe. It does not include higher-timeframe confirmation, volatility filtering, or volume filtering.
LIVE-BAR BEHAVIOR
Signals are not explicitly restricted to closed candles.
EMA values, ribbon colors, table readings, and markers can change while the current candle develops. An intrabar marker can disappear before the candle closes.
The indicator should not be described as non-repainting.
LIMITATIONS
The script does not calculate trading performance, account profit, drawdown, or execution-adjusted results.
DISCLAIMER
For educational and analytical use only. This indicator does not provide personalized financial advice or guarantee trading results. Users are responsible for their own analysis, risk management, position sizing, and execution decisions.
SUPER INDIBOT is an eight-EMA ribbon that visualizes moving-average alignment through a color gradient, trend-transition markers, and a compact status table.
The indicator helps users distinguish fully ordered EMA structures from partially aligned conditions. It uses standard exponential moving averages and adjacent-pair comparisons, not machine learning or automated trade execution.
EIGHT-EMA RIBBON
The ribbon calculates eight EMAs from closing prices.
Default lengths:
- 5
- 11
- 15
- 18
- 21
- 24
- 28
- 34
All lengths are adjustable. To preserve the intended short-to-long interpretation, keep them in ascending order.
The script compares the EMAs in their input order; it does not automatically sort custom lengths.
A shaded fill connects the first and eighth EMAs, while the eighth EMA uses a thicker line to help identify the ribbon’s longer-period boundary.
ALIGNMENT CALCULATION
The system evaluates seven adjacent EMA pairs:
EMA 1 versus EMA 2, EMA 2 versus EMA 3, and so on through EMA 7 versus EMA 8.
Each comparison contributes one point when the earlier EMA is strictly above the next EMA.
Displayed percentage = Bullish pair count ÷ 7 × 100
Examples:
- 100%: All seven comparisons are bullish.
- Approximately 57%: Four of seven comparisons are bullish.
- Approximately 43%: Three of seven comparisons are bullish.
- 0%: None of the seven comparisons are bullish.
The percentage measures bullish alignment—not trend quality, confidence, or probability of success.
A reading of 0% is the bearish end of the scale, not an absence of directional alignment. Equal EMA values also contribute zero, so 0% does not strictly guarantee that every pair is bearish.
RIBBON COLORS
The ribbon uses a continuous gradient between the selected bearish and bullish colors.
- Higher percentages shift the ribbon toward the bullish color.
- Lower percentages shift the ribbon toward the bearish color.
- Intermediate percentages display blended colors.
The gradient reflects how many adjacent comparisons are bullish. It does not measure EMA separation, slope, trading volume, volatility, or price momentum.
The “Neutral color” input is present in this version but is not used by the ribbon, signals, or table.
TREND STATUS TABLE
The optional table appears in the upper-right corner and displays the trend classification and alignment percentage.
Classifications:
- Strong Up: All seven comparisons are bullish.
- Mild Up: Four to six comparisons are bullish.
- Mild Down: One to three comparisons are bullish.
- Strong Down: No comparisons are bullish.
“Strong” describes the completeness of the EMA ordering, not a verified measure of trend strength or expected returns.
The code includes a “Mixed” classification for an exact 50% reading. However, seven binary comparisons cannot produce exactly 50%, so this classification is not normally displayed.
BUY AND SELL MARKERS
- BUY: The ribbon enters the fully bullish state.
- SELL: The ribbon enters the zero-bullish-comparison state.
Markers appear when the relevant full-alignment state begins, not on every bar while it persists.
A signal does not require a complete reversal from the opposite trend. If the ribbon leaves full alignment and later returns to the same full-alignment state, another marker can appear.
These labels identify alignment transitions. They are not order instructions and do not include stop-loss levels, profit targets, or position sizing.
ALERTS
The indicator provides two alert conditions:
- Ribbon Bull Flip: The ribbon enters full bullish alignment.
- Ribbon Bear Flip: The ribbon enters the zero-bullish-comparison state.
Turning off “Show trend-flip signals” hides the chart markers but does not disable the alert conditions.
For close-based notifications, select “Once Per Bar Close” when creating an alert.
SUGGESTED WORKFLOW
- Review the ribbon color and table to assess current EMA alignment.
- Distinguish fully aligned conditions from partial alignment.
- Evaluate new BUY or SELL markers alongside price structure and your own analysis.
- Define risk, invalidation, and potential exits independently.
- Adjust EMA lengths to suit the instrument and timeframe while maintaining their intended order.
The indicator operates on the current chart timeframe. It does not include higher-timeframe confirmation, volatility filtering, or volume filtering.
LIVE-BAR BEHAVIOR
Signals are not explicitly restricted to closed candles.
EMA values, ribbon colors, table readings, and markers can change while the current candle develops. An intrabar marker can disappear before the candle closes.
The indicator should not be described as non-repainting.
LIMITATIONS
- EMAs are lagging calculations and may respond after a price move has already developed.
- Sideways markets can produce repeated alignment transitions.
- Full alignment does not guarantee trend continuation.
- The percentage is a directional alignment scale, not a win rate.
- Custom EMA lengths can materially change the interpretation of the ribbon.
- This is an indicator, not a backtesting strategy or trading bot.
The script does not calculate trading performance, account profit, drawdown, or execution-adjusted results.
DISCLAIMER
For educational and analytical use only. This indicator does not provide personalized financial advice or guarantee trading results. Users are responsible for their own analysis, risk management, position sizing, and execution decisions.

Disclaimer
The information and publications are not meant to be, and do not constitute, financial, investment, trading, or other types of advice or recommendations supplied or endorsed by TradingView. Read more in the Terms of Use.
Disclaimer
The information and publications are not meant to be, and do not constitute, financial, investment, trading, or other types of advice or recommendations supplied or endorsed by TradingView. Read more in the Terms of Use.