OPEN-SOURCE SCRIPT
Volumetric Trend Ribbon Pro [ChartPrime]
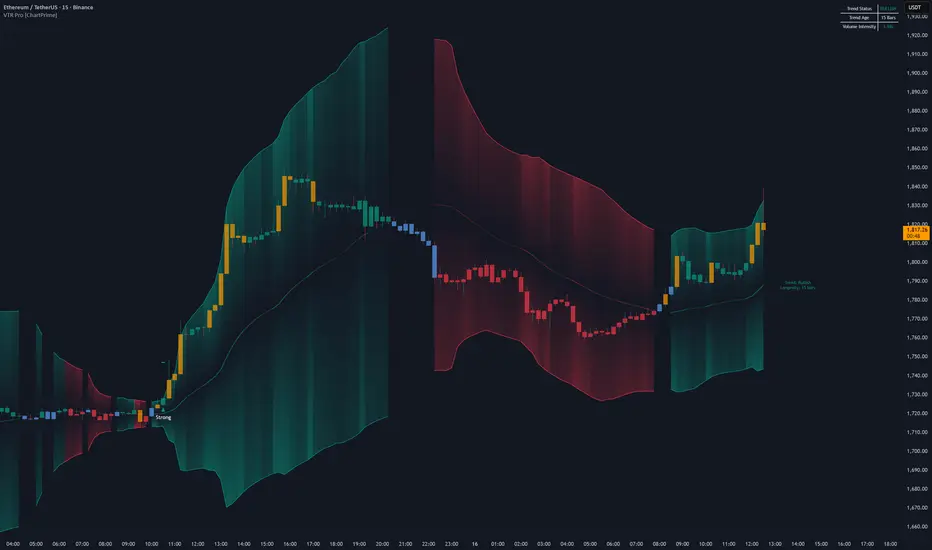
🔶 OVERVIEW
Volumetric Trend Ribbon Pro [ChartPrime] is a professional-grade trend-following overlay that synchronizes price action with volume-weighted volatility. Unlike standard moving averages that only track price, this indicator uses a Volume-Weighted Standard Deviation (VWSD) engine to create a dynamic "ribbon" that expands during high-conviction moves and contracts during market indecision.
The tool is designed to provide a comprehensive workspace for trend traders, featuring automated breakout targets, institutional volume spike detection, and a real-time analytics dashboard.
• Volume-Weighted Moving Average (VWMA) Core
• NEW: Adaptive Transparency (Volume-to-Average Ratio)
• NEW: Dynamic Breakout Targets (Volatility-Adjusted)
• Institutional Volume Spike Highlighting (Orange Candles)
• Floating "Trend & Longevity" Labels
• Integrated Status Dashboard (Trend Age & Vol Intensity)
• Customizable Themed Candle Plotting
🔶 CORE CONCEPT — VOLUMETRIC ADAPTABILITY
Standard ribbons often suffer from "lag" or "noise" during low-volume consolidation. VTR Pro solves this by integrating volume into every calculation:
• VWSD Expansion: The ribbon’s width is determined by volume-weighted volatility. When "Smart Money" enters the market, the ribbon widens, providing a clear visual of trend strength.
• Adaptive Transparency: The indicator’s visibility reacts to current volume. High-volume moves appear bold and opaque, while low-volume "chop" fades into the background, signaling a lack of institutional interest.
• Volume Spikes: Regardless of the current trend, the script identifies abnormal volume surges (1.5x average) and highlights the candles in Orange, marking potential exhaustion or ignition points.
🔶 DYNAMIC BREAKOUT TARGETS
The indicator features an automated target projection system that appears when price breaks out of the ribbon with high momentum.
🔶 TREND DASHBOARD & FLOATING LABELS
To provide institutional-level data at a glance, VTR Pro includes two intelligent UI elements:
🔶 HOW TO USE
🔶 CONCLUSION
Volumetric Trend Ribbon Pro [ChartPrime] transforms the traditional ribbon into a data-rich environment. By prioritizing volume intensity and providing automated targets, it removes the guesswork from trend-following and helps traders stay on the right side of institutional flow.
Volumetric Trend Ribbon Pro [ChartPrime] is a professional-grade trend-following overlay that synchronizes price action with volume-weighted volatility. Unlike standard moving averages that only track price, this indicator uses a Volume-Weighted Standard Deviation (VWSD) engine to create a dynamic "ribbon" that expands during high-conviction moves and contracts during market indecision.
The tool is designed to provide a comprehensive workspace for trend traders, featuring automated breakout targets, institutional volume spike detection, and a real-time analytics dashboard.
• Volume-Weighted Moving Average (VWMA) Core
• NEW: Adaptive Transparency (Volume-to-Average Ratio)
• NEW: Dynamic Breakout Targets (Volatility-Adjusted)
• Institutional Volume Spike Highlighting (Orange Candles)
• Floating "Trend & Longevity" Labels
• Integrated Status Dashboard (Trend Age & Vol Intensity)
• Customizable Themed Candle Plotting
🔶 CORE CONCEPT — VOLUMETRIC ADAPTABILITY
Standard ribbons often suffer from "lag" or "noise" during low-volume consolidation. VTR Pro solves this by integrating volume into every calculation:
• VWSD Expansion: The ribbon’s width is determined by volume-weighted volatility. When "Smart Money" enters the market, the ribbon widens, providing a clear visual of trend strength.
• Adaptive Transparency: The indicator’s visibility reacts to current volume. High-volume moves appear bold and opaque, while low-volume "chop" fades into the background, signaling a lack of institutional interest.
• Volume Spikes: Regardless of the current trend, the script identifies abnormal volume surges (1.5x average) and highlights the candles in Orange, marking potential exhaustion or ignition points.
🔶 DYNAMIC BREAKOUT TARGETS
The indicator features an automated target projection system that appears when price breaks out of the ribbon with high momentum.
- Volatility-Based: Targets are not fixed percentages; they are calculated based on the current width of the ribbon (the market's recent volatility).
- Adjustable Multiplier: Traders can fine-tune the "Target Distance" input to match their specific strategy (Scalping vs. Swing Trading).
- Auto-Hide Logic: Target lines automatically clear once the trend weakens or the level is mitigated, keeping the chart clean and focused.
🔶 TREND DASHBOARD & FLOATING LABELS
To provide institutional-level data at a glance, VTR Pro includes two intelligent UI elements:
- Floating Trend Label: Plotted directly at the end of the middle trend line, this label tracks the current "Longevity" of the move (number of bars in trend), allowing you to identify over-extended trends.
- Status Dashboard: A top-right table that monitors:
- Trend Status: (Bullish / Bearish / Neutral)
- Trend Age: The exact duration of the current cycle.
- Vol Intensity: A real-time multiplier showing how much volume is flowing relative to the 40-bar average.
🔶 HOW TO USE
- Trend Confirmation: Enter long when the ribbon turns Green and price holds above the upper edge. Confirm with a "Strong" momentum signal.
- Spotting Exhaustion: Watch the Trend Age on the dashboard. If a trend has lasted 50+ bars without a contraction, look for Orange Volume Spikes as potential signs of blow-off tops or bottoms.
- Managing Targets: Use the projected Target Lines as logical take-profit levels or areas to move your stop-loss to break-even.
- Avoiding Chop: When the ribbon turns Blue (Neutral) and the transparency fades, the market is in equilibrium. This is a "No-Trade Zone" for trend followers.
🔶 CONCLUSION
Volumetric Trend Ribbon Pro [ChartPrime] transforms the traditional ribbon into a data-rich environment. By prioritizing volume intensity and providing automated targets, it removes the guesswork from trend-following and helps traders stay on the right side of institutional flow.
Open-source script
In true TradingView spirit, the creator of this script has made it open-source, so that traders can review and verify its functionality. Kudos to the author! While you can use it for free, remember that republishing the code is subject to our House Rules.

Disclaimer
The information and publications are not meant to be, and do not constitute, financial, investment, trading, or other types of advice or recommendations supplied or endorsed by TradingView. Read more in the Terms of Use.
Open-source script
In true TradingView spirit, the creator of this script has made it open-source, so that traders can review and verify its functionality. Kudos to the author! While you can use it for free, remember that republishing the code is subject to our House Rules.
Disclaimer
The information and publications are not meant to be, and do not constitute, financial, investment, trading, or other types of advice or recommendations supplied or endorsed by TradingView. Read more in the Terms of Use.