OPEN-SOURCE SCRIPT
Quantum Breakout AI [AnkeAlgo]
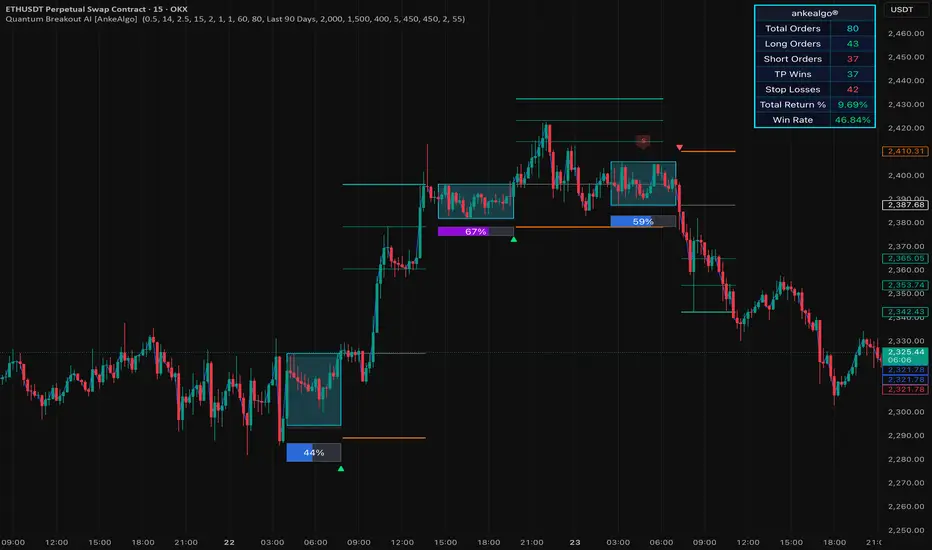
Why Market Structure Needs a Quantum Leap
Most breakout indicators on TradingView suffer from a fundamental problem: they treat every range the same. A two-bar consolidation gets the same visual treatment as a fifty-bar compression zone with multiple rejections and volume anomalies. The result is noise — false signals, premature entries, and a chart cluttered with levels that have no context.
Quantum Breakout AI [AnkeAlgo] was built to solve exactly this. Instead of drawing static boxes, it treats each consolidation zone as a living structure with its own lifecycle, energy signature, and directional bias. The indicator doesn't just show you where price is compressing — it tells you how mature that compression is, how much energy has accumulated, whether the smart money has been active, and which direction the breakout is most likely to take. This is the difference between reading a map and reading the weather.
The Core Concept: Zones as Living Structures
At the heart of this indicator is a custom data type called MarketStructureZone. Each zone stores not just its price boundaries, but a rich set of attributes that evolve bar by bar: power score, lifecycle stage, directional bias, rejection counts at both boundaries, VWAP level, whale activity score, and quality score. This isn't a static rectangle — it's a dynamic entity that the indicator continuously updates as long as price remains within the compression range.
The zone detection logic begins with a simple compression check: when the 5-bar range falls below the ATR multiplied by the Range ATR Mult input, the indicator starts tracking a potential zone.
This threshold is critical — it determines how sensitive the indicator is to consolidation patterns. A lower multiplier means more zones will be detected, including weaker ones. A higher multiplier filters for only the tightest compressions, which tend to produce more explosive breakouts but occur less frequently.
Once a zone is active, the indicator tracks every bar that stays within the boundaries (with a small tolerance buffer). Each bar extends the zone's duration and triggers a full recalculation of its attributes. The power score is computed from four components: squeeze ratio (how tight the range is relative to volatility), duration score (longer compressions accumulate more energy), age bonus for zones exceeding 30 bars, and tightness bonus for exceptionally narrow ranges. This multi-factor approach prevents the indicator from overvaluing long but loose consolidations or short but extremely tight ones.
Directional Bias: Reading the Market's Intentions
One of the most sophisticated features is the directional bias analysis, which combines two independent signals. The first is VWAP positioning — by calculating the volume-weighted mean price within the zone and comparing it to the zone's midpoint, the indicator determines whether volume is concentrated toward the top or bottom. The second is rejection wick analysis, which counts how many times price touched each boundary but closed back inside the zone, with a significant wick. A high number of top rejections with long upper wicks suggests sellers are defending that level, while bottom rejections indicate buyer support.
These two signals are weighted 55% and 45% respectively to produce a final bias score.
The weighting reflects the developer's research that volume positioning is slightly more reliable than wick analysis, but both are necessary — volume tells you where the money is, while wicks tell you where the resistance is. The confidence score is then clamped between 50 and 100, with the Min Confidence % input filtering out zones where the bias isn't strong enough to display a directional marker.
Whale Activity and Zone Quality
The whale activity detection adds another layer of sophistication. The indicator scans each zone for bars where volume exceeds the configured multiplier times the 20-bar average volume, but only if price stayed within the zone boundaries. This filters out volume spikes caused by breakouts or breakdowns and focuses on accumulation or distribution within the range. Each anomalous volume bar contributes to a score that combines the frequency of spikes with their intensity.
The final quality score is a weighted composite of four factors: power score (35%), whale activity (20%), lifecycle stage value (25%), and directional confidence (20%). The lifecycle stage value peaks at the Mature phase (80 points), reflecting the developer's observation that zones typically reach maximum breakout potential just before they begin to exhaust. This scoring system allows the indicator to rank zones by quality, which is particularly useful when multiple zones are visible on the chart.
Visual Design
The visual presentation is deliberately cinematic. Each zone is rendered as a two-layer stereo box — a shadow layer offset slightly downward in price to create a 3D depth effect, and a main layer with a semi-transparent cyan fill and border. This isn't just aesthetic; the depth effect helps zones stand out against the price action, making it immediately obvious which areas of the chart have been analyzed.
The energy bar sits below each zone and provides a real-time visual of the power score. The bar's fill color transitions through four stages: green for low energy (below 40), blue for medium (40 to high threshold), purple for high (high threshold to critical threshold), and red for critical (above critical threshold). This color coding creates an intuitive heat map — the eye is drawn to zones where the energy is building toward critical levels.
Directional bias markers appear as "B" or "S" labels with colored backgrounds, positioned relative to the zone's energy bar. These only display when the confidence score meets the minimum threshold, preventing the chart from becoming cluttered with low-conviction signals.
Trade Management: From Detection to Execution
When a breakout occurs, the indicator automatically calculates complete trade management levels. The entry is set at the breached boundary, the stop loss is placed on the opposite side of the zone plus an ATR buffer, and take-profit levels are calculated at 1R, 1.5R, and 2R. The ATR buffer on the stop is critical — it prevents the stop from being placed exactly at the zone boundary, where it could be triggered by a wick or a false breakout retest.
The partial position closing logic is particularly sophisticated. The indicator tracks three separate close ratios for TP1, TP2, and TP3, allowing traders to scale out of positions. For example, with TP1 Close Ratio set to 2, TP2 to 1, and TP3 to 1, the trader would close 50% of the position at TP1, 25% at TP2, and 25% at TP3. The statistics system tracks these partial closes independently, calculating weighted P&L contributions for each target.
The trade exit logic handles three scenarios: hitting the stop loss, hitting the final take-profit level, or a new zone forming while a trade is active. This last case is important — if price consolidates again after a breakout, the indicator closes the existing trade to avoid holding through another compression phase.
The Statistics Engine: Honest Performance Tracking
The statistics table is not a backtesting engine, but it provides honest, transparent tracking of every zone that triggered a trade. It filters trades by the configured time range (Last 30 Days, Last 90 Days, Year 2025, or custom dates) and displays total orders, long/short breakdown, TP wins, stop losses, total return percentage, and win rate.
The total return calculation uses equity curve compounding — each trade's P&L percentage is applied multiplicatively to a starting equity of 1.0. This is more accurate than simple summation because it accounts for the compounding effect of consecutive wins and losses. The win rate is calculated only against closed trades (those that hit either a target or the stop), excluding trades that are still active or were closed by new zone formation.
Limitations and Realistic Expectations
No indicator is perfect, and Quantum Breakout AI has specific conditions where it performs best and worst. The zone detection relies on compression, which means it will generate fewer signals during strong trending markets where price rarely consolidates. The energy scoring system can produce high scores for zones that ultimately fail — energy is a measure of potential, not certainty.
The ATR-based parameters need careful tuning for each instrument. A Range ATR Mult of 2.5 that works well on Bitcoin may be too tight for Apple stock or too loose for a low-volatility forex pair. Similarly, the SL ATR Mult of 0.5 may need adjustment based on how much noise the instrument typically has at the zone boundaries.
The statistics table should be interpreted with caution. It reflects historical performance within the configured range, but market regimes change. A 70% win rate over the last 90 days does not guarantee the next 90 days will be similar. The indicator is a tool for analysis and visualization, not a crystal ball.
Best Use Cases and Practical Application
This indicator shines in range-bound and consolidating markets where traditional trend-following tools struggle. Swing traders can use the zone quality score to prioritize the strongest setups, focusing on zones that reach the Mature lifecycle stage with high energy and strong directional bias. The imminent breakout alert provides a warning when a zone reaches critical energy levels, allowing traders to prepare for the move without watching the chart constantly.
The partial position closing system is ideal for traders who want to lock in profits while letting runners develop. By configuring the close ratios, traders can create custom risk management profiles — conservative traders might close 70% at TP1, while aggressive traders might close only 30% and let the rest ride to TP3.
For quantitative traders, the zone attributes provide rich data for further analysis. The power score, quality score, and directional confidence can be exported or used as inputs to other systems. The whale activity detection offers insights into institutional behavior that most retail tools miss entirely.
Open-source script
In true TradingView spirit, the creator of this script has made it open-source, so that traders can review and verify its functionality. Kudos to the author! While you can use it for free, remember that republishing the code is subject to our House Rules.

Disclaimer
The information and publications are not meant to be, and do not constitute, financial, investment, trading, or other types of advice or recommendations supplied or endorsed by TradingView. Read more in the Terms of Use.
Open-source script
In true TradingView spirit, the creator of this script has made it open-source, so that traders can review and verify its functionality. Kudos to the author! While you can use it for free, remember that republishing the code is subject to our House Rules.
Disclaimer
The information and publications are not meant to be, and do not constitute, financial, investment, trading, or other types of advice or recommendations supplied or endorsed by TradingView. Read more in the Terms of Use.