Nexus Volume Profile - Session POC and Value Area
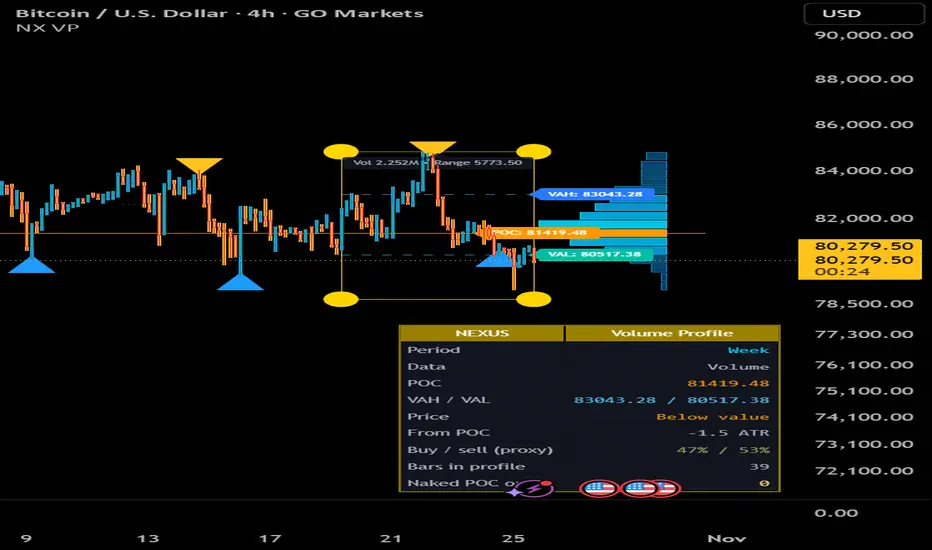
Nexus Volume Profile draws a session volume profile on the chart. It shows the Point of Control (POC), the value area (VAH / VAL, 70% of volume) and naked POCs from past periods. Candles are blue (up) and yellow (down) with wicks in the same color. Small price capsules and a Vol / Range capsule sit inside the frame. Blue buy triangles and yellow sell triangles appear when price touches a frame edge and a candle closes the other way. A dashboard and 8 alerts are included.
How to use it:
1. Add it to the chart. The profile for the current period appears at the far right.
2. POC is the price with the most traded volume, and it often acts as a magnet. VAH and VAL are the edges of the value area. Price above VAH means strength, and below VAL means weakness.
3. Price inside the value area usually means balance or range. A blue triangle (buy) near the bottom edge or a yellow triangle (sell) near the top edge suggests a bounce from the frame edges.
4. A naked POC from a past period is a level price has not revisited yet, and it often gets tested later.
5. In Settings, "Period" selects the profile length, and "Rows" controls how detailed the profile is.
Which timeframe:
- Auto mode: 1m to 1h charts use the daily profile (best for scalping and intraday, 5m to 15m is the sweet spot), 2h to 12h charts use the weekly profile, daily charts use the monthly profile, and weekly charts use the yearly profile.
- "Auto session" gives one profile per Asia, London and New York session on charts up to 1h.
- Triangle signals need at least 12 bars in the current period, so very high timeframes give few signals.
Honest limitation: on forex and gold the volume is often tick volume or missing, so the tool uses time-at-price (TPO) and labels it. The buy / sell split is a candle-direction estimate, not real delta. This is an analysis tool and not a promise of profit.

Disclaimer
The information and publications are not meant to be, and do not constitute, financial, investment, trading, or other types of advice or recommendations supplied or endorsed by TradingView. Read more in the Terms of Use.
Disclaimer
The information and publications are not meant to be, and do not constitute, financial, investment, trading, or other types of advice or recommendations supplied or endorsed by TradingView. Read more in the Terms of Use.