Rolling Fibonacci Range
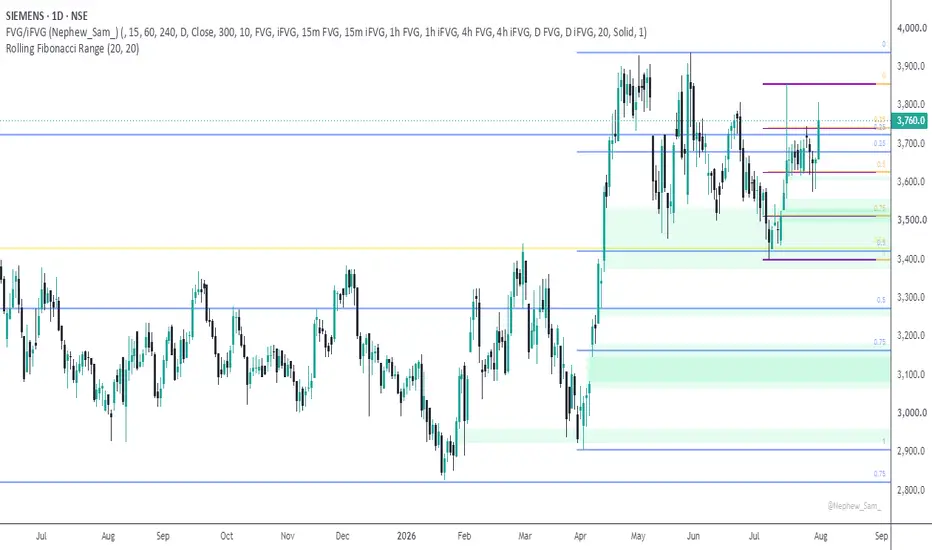
Automatically plots rolling Fibonacci levels from the highest high and lowest low of the last N candles. Includes dynamic current-timeframe levels and static Daily Fibonacci levels for multi-timeframe support and resistance analysis. Suitable for intraday, swing, and positional trading across stocks, indices, forex, futures, and cryptocurrencies.
Rolling Fibonacci Range is a dynamic support and resistance indicator that automatically calculates Fibonacci levels from the highest high and lowest low of the last N candles. It helps traders identify important price zones without manually drawing Fibonacci retracements.
The indicator also includes a Multi-Timeframe Daily Fibonacci, allowing traders to monitor higher-timeframe levels while trading on lower timeframes.
Features
✅ Automatic Fibonacci calculation using the last N candles (default: 19)
✅ Dynamic levels that update with every new candle
✅ Static Daily Fibonacci that remains unchanged when switching between intraday timeframes
✅ Works on all markets:
Stocks
Indices
Futures
Forex
Crypto
✅ Supports all chart timeframes
Fibonacci Levels
The indicator calculates:
0.00 → Highest High
0.25
0.50
0.75
1.00 → Lowest Low
These levels act as potential:
Support
Resistance
Pullback zones
Breakout confirmation areas
Current Timeframe Levels
The purple levels represent the rolling Fibonacci range calculated using the current chart timeframe.
Example:
5-minute chart → Last 19 five-minute candles
15-minute chart → Last 19 fifteen-minute candles
1-hour chart → Last 19 one-hour candles
These levels continuously adapt to market structure.
Daily Fibonacci
The orange levels are calculated using the last 19 Daily candles.
Unlike the current timeframe levels, these remain constant while viewing:
1 Minute
3 Minute
5 Minute
15 Minute
30 Minute
1 Hour
4 Hour
The Daily Fibonacci updates only when a new daily candle is completed.
This helps intraday traders trade with higher-timeframe support and resistance.
How to Use
Bullish Market
Price holding above the 0.50 level suggests buyers remain in control.
A breakout above 0.25 often indicates bullish momentum.
A move above 0.00 (Highest High) may signal continuation.
Bearish Market
Price below 0.50 indicates weakness.
Rejection near 0.25 can provide short opportunities.
A break below 1.00 (Lowest Low) may confirm bearish continuation.
Best Use Cases
This indicator works well for:
Trend Following
Breakout Trading
Pullback Entries
Swing Trading
Intraday Trading
Support & Resistance Analysis
Multi-Timeframe Confluence
Recommended Settings
Default Lookback:
20 Candles
You can increase the lookback for smoother levels or decrease it for faster adaptation.
Rolling Fibonacci Range is a dynamic support and resistance indicator that automatically calculates Fibonacci levels from the highest high and lowest low of the last N candles. It helps traders identify important price zones without manually drawing Fibonacci retracements.
The indicator also includes a Multi-Timeframe Daily Fibonacci, allowing traders to monitor higher-timeframe levels while trading on lower timeframes.
Features
✅ Automatic Fibonacci calculation using the last N candles (default: 19)
✅ Dynamic levels that update with every new candle
✅ Static Daily Fibonacci that remains unchanged when switching between intraday timeframes
✅ Works on all markets:
Stocks
Indices
Futures
Forex
Crypto
✅ Supports all chart timeframes
Fibonacci Levels
The indicator calculates:
0.00 → Highest High
0.25
0.50
0.75
1.00 → Lowest Low
These levels act as potential:
Support
Resistance
Pullback zones
Breakout confirmation areas
Current Timeframe Levels
The purple levels represent the rolling Fibonacci range calculated using the current chart timeframe.
Example:
5-minute chart → Last 19 five-minute candles
15-minute chart → Last 19 fifteen-minute candles
1-hour chart → Last 19 one-hour candles
These levels continuously adapt to market structure.
Daily Fibonacci
The orange levels are calculated using the last 19 Daily candles.
Unlike the current timeframe levels, these remain constant while viewing:
1 Minute
3 Minute
5 Minute
15 Minute
30 Minute
1 Hour
4 Hour
The Daily Fibonacci updates only when a new daily candle is completed.
This helps intraday traders trade with higher-timeframe support and resistance.
How to Use
Bullish Market
Price holding above the 0.50 level suggests buyers remain in control.
A breakout above 0.25 often indicates bullish momentum.
A move above 0.00 (Highest High) may signal continuation.
Bearish Market
Price below 0.50 indicates weakness.
Rejection near 0.25 can provide short opportunities.
A break below 1.00 (Lowest Low) may confirm bearish continuation.
Best Use Cases
This indicator works well for:
Trend Following
Breakout Trading
Pullback Entries
Swing Trading
Intraday Trading
Support & Resistance Analysis
Multi-Timeframe Confluence
Recommended Settings
Default Lookback:
20 Candles
You can increase the lookback for smoother levels or decrease it for faster adaptation.

Disclaimer
The information and publications are not meant to be, and do not constitute, financial, investment, trading, or other types of advice or recommendations supplied or endorsed by TradingView. Read more in the Terms of Use.
Disclaimer
The information and publications are not meant to be, and do not constitute, financial, investment, trading, or other types of advice or recommendations supplied or endorsed by TradingView. Read more in the Terms of Use.