Updated
RC Tools - VIDYA Adaptive Trend
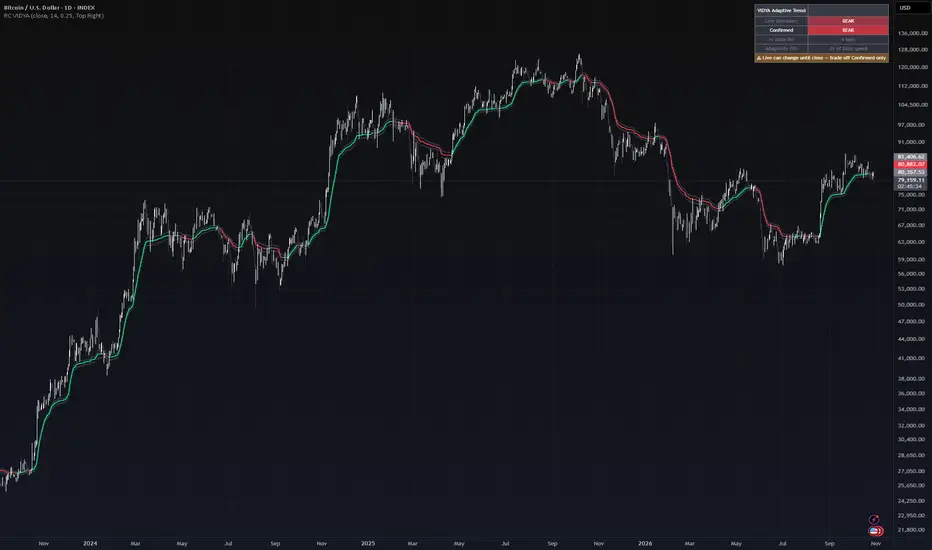
RC Tools — VIDYA Adaptive Trend
────────────────────────────────────────────────────────────────────
█ OVERVIEW
A standard moving average runs at one fixed speed whether the market is trending cleanly or going nowhere. That is exactly why it whipsaws in chop. Tushar Chande's VIDYA (Variable Index Dynamic Average) fixes the speed problem instead of the lag problem: it speeds up when price is moving decisively in one direction, and slows to a near standstill when price is just going back and forth.
█ WHAT IT DOES
Plots an adaptive moving average directly on the price chart, coloured Bullish or Bearish. The state only flips when price clears the line by a configurable multiple of ATR, and holds otherwise, so ordinary noise around the line does not keep flipping it. A table shows the live (intrabar) state next to the confirmed state, how long the current state has lasted, and how fast the average is currently adapting.
█ THE THEORY BEHIND IT
VIDYA is an exponential moving average whose smoothing constant is scaled each bar by a trend index. The trend index is the absolute value of the Chande Momentum Oscillator (CMO), which compares the sum of up-moves with the sum of down-moves over a lookback window. If almost every move in the window was in one direction, the index is close to 1 and the average follows price almost as quickly as a normal EMA. If ups and downs roughly cancel, the index is close to 0 and the average barely moves. In effect, price movement decides how fast the average is allowed to react.
█ HOW IT IS CALCULATED
1. CMO = (sum of up-moves - sum of down-moves) / (sum of up-moves + sum of down-moves) over the lookback window.
2. Trend index VI = |CMO|, between 0 and 1.
3. Base smoothing constant alpha = 2 / (length + 1), the standard EMA constant.
4. VIDYA = (alpha x VI) x price + (1 - alpha x VI) x previous VIDYA.
5. Buffer band = VIDYA +/- (buffer multiple x ATR). Price above the upper band sets the state Bullish, price below the lower band sets it Bearish, and anything inside the band keeps the previous state.
State classification occurs ONLY on confirmed bar close. The VIDYA line itself plots live, exactly like any moving average on any chart; that is normal behaviour, not repainting.
█ SETTINGS & CONFIGURATION
• Source (default close)
• Length (default 14) — sets the CMO lookback, the base speed, and the ATR period together, as in Chande's original single-window design
• Confirmation Buffer, in ATR multiples (default 0.25; 0 = flip the instant price crosses the line)
• Show Buffer Band, table visibility and position, colours and optional chart background tint are all configurable
█ HOW TO USE IT
Use it as a trend-state filter that is calmer in sideways markets than a fixed-speed average, not as a standalone entry signal. A nearly flat VIDYA line is information: it means recent movement has been two-way and the tool is deliberately not reacting. The "Adaptivity" row in the table shows the current trend index as a percentage of the base EMA speed, so you can see how much the line is currently willing to move. Only the Confirmed row is safe to treat as settled; the Live row can still change until the bar closes.
Works on any asset and timeframe.
█ LIMITATIONS
• VIDYA is still a moving average and lags price by construction. Adaptivity reduces whipsaw in chop; it does not remove lag.
• A flat line in a sideways market is the tool working as designed, not a fault. The flip side is that it can be slow to respond when a trend starts out of a long quiet period, because the trend index is still low.
• The confirmation buffer is a trade-off: it cuts false flips but delays genuine ones. Higher values give fewer, later flips.
• Length drives three things at once (CMO window, base speed, ATR period). That is faithful to the original design, but one input changes several behaviours together.
• The VIDYA line plots live like any moving average. Only the state and colour are held to confirmed bars.
• Two states are a deliberate simplification of a continuous reality.
█ DISCLAIMER
For educational and informational purposes only. Nothing here is financial advice. Past behaviour of any trend state does not indicate future results. Trade at your own risk.
────────────────────────────────────────────────────────────────────
────────────────────────────────────────────────────────────────────
█ OVERVIEW
A standard moving average runs at one fixed speed whether the market is trending cleanly or going nowhere. That is exactly why it whipsaws in chop. Tushar Chande's VIDYA (Variable Index Dynamic Average) fixes the speed problem instead of the lag problem: it speeds up when price is moving decisively in one direction, and slows to a near standstill when price is just going back and forth.
█ WHAT IT DOES
Plots an adaptive moving average directly on the price chart, coloured Bullish or Bearish. The state only flips when price clears the line by a configurable multiple of ATR, and holds otherwise, so ordinary noise around the line does not keep flipping it. A table shows the live (intrabar) state next to the confirmed state, how long the current state has lasted, and how fast the average is currently adapting.
█ THE THEORY BEHIND IT
VIDYA is an exponential moving average whose smoothing constant is scaled each bar by a trend index. The trend index is the absolute value of the Chande Momentum Oscillator (CMO), which compares the sum of up-moves with the sum of down-moves over a lookback window. If almost every move in the window was in one direction, the index is close to 1 and the average follows price almost as quickly as a normal EMA. If ups and downs roughly cancel, the index is close to 0 and the average barely moves. In effect, price movement decides how fast the average is allowed to react.
█ HOW IT IS CALCULATED
1. CMO = (sum of up-moves - sum of down-moves) / (sum of up-moves + sum of down-moves) over the lookback window.
2. Trend index VI = |CMO|, between 0 and 1.
3. Base smoothing constant alpha = 2 / (length + 1), the standard EMA constant.
4. VIDYA = (alpha x VI) x price + (1 - alpha x VI) x previous VIDYA.
5. Buffer band = VIDYA +/- (buffer multiple x ATR). Price above the upper band sets the state Bullish, price below the lower band sets it Bearish, and anything inside the band keeps the previous state.
State classification occurs ONLY on confirmed bar close. The VIDYA line itself plots live, exactly like any moving average on any chart; that is normal behaviour, not repainting.
█ SETTINGS & CONFIGURATION
• Source (default close)
• Length (default 14) — sets the CMO lookback, the base speed, and the ATR period together, as in Chande's original single-window design
• Confirmation Buffer, in ATR multiples (default 0.25; 0 = flip the instant price crosses the line)
• Show Buffer Band, table visibility and position, colours and optional chart background tint are all configurable
█ HOW TO USE IT
Use it as a trend-state filter that is calmer in sideways markets than a fixed-speed average, not as a standalone entry signal. A nearly flat VIDYA line is information: it means recent movement has been two-way and the tool is deliberately not reacting. The "Adaptivity" row in the table shows the current trend index as a percentage of the base EMA speed, so you can see how much the line is currently willing to move. Only the Confirmed row is safe to treat as settled; the Live row can still change until the bar closes.
Works on any asset and timeframe.
█ LIMITATIONS
• VIDYA is still a moving average and lags price by construction. Adaptivity reduces whipsaw in chop; it does not remove lag.
• A flat line in a sideways market is the tool working as designed, not a fault. The flip side is that it can be slow to respond when a trend starts out of a long quiet period, because the trend index is still low.
• The confirmation buffer is a trade-off: it cuts false flips but delays genuine ones. Higher values give fewer, later flips.
• Length drives three things at once (CMO window, base speed, ATR period). That is faithful to the original design, but one input changes several behaviours together.
• The VIDYA line plots live like any moving average. Only the state and colour are held to confirmed bars.
• Two states are a deliberate simplification of a continuous reality.
█ DISCLAIMER
For educational and informational purposes only. Nothing here is financial advice. Past behaviour of any trend state does not indicate future results. Trade at your own risk.
────────────────────────────────────────────────────────────────────
Release Notes
Changed descriptive code in line with other published indicators
Disclaimer
The information and publications are not meant to be, and do not constitute, financial, investment, trading, or other types of advice or recommendations supplied or endorsed by TradingView. Read more in the Terms of Use.
Disclaimer
The information and publications are not meant to be, and do not constitute, financial, investment, trading, or other types of advice or recommendations supplied or endorsed by TradingView. Read more in the Terms of Use.