OPEN-SOURCE SCRIPT
Updated Luminous Glide Momentum Indicator [wjdtks255]
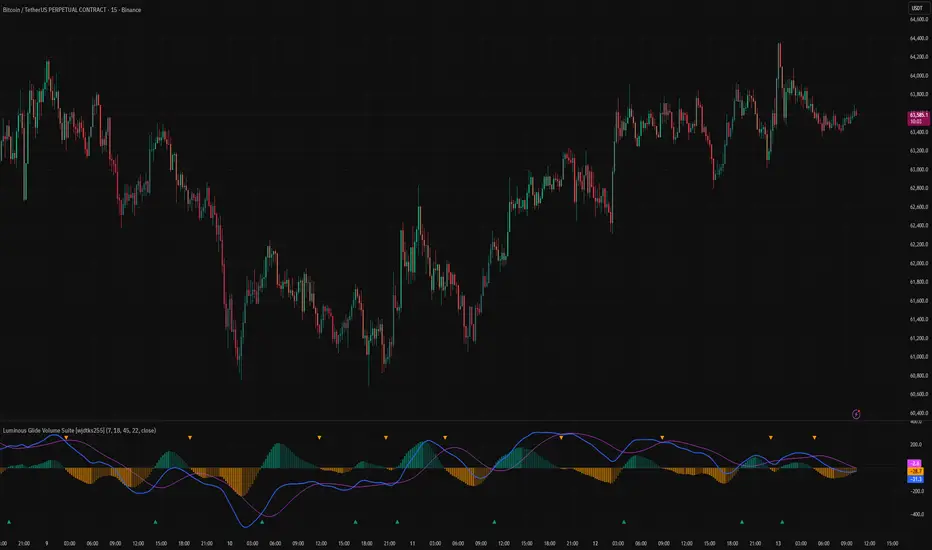
This indicator, named "Customized SuperSmoother MA Oscillator," applies a smoothing filter to price data using a SuperSmoother technique to reduce noise and enhance signal clarity. It calculates two moving averages on the smoothed data—a fast and a slow—whose difference forms the oscillator line. A signal line is derived by smoothing the oscillator with another moving average. The histogram visualizes the divergence between the oscillator and signal lines, indicating momentum strength and direction.
How it works
SuperSmoother Filter: Reduces price noise to provide smoother and more reliable signals than raw data.
Fast and Slow Moving Averages: The fast MA reacts quicker to price changes, while the slow MA indicates longer trends.
Oscillator: The difference between the fast and slow MAs signals shifts in momentum.
Signal Line: A smoothed version of the oscillator used to generate crossovers.
Histogram: Displays the distance between the oscillator and signal line, with color changes indicating bullish or bearish momentum.
Trading Strategy
Buy Signal: When the oscillator crosses above the signal line, it suggests increasing upward momentum, signaling a potential buy opportunity.
Sell Signal: When the oscillator crosses below the signal line, it suggests increasing downward momentum, signaling a potential sell opportunity.
Histogram Size and Color: Larger green bars indicate stronger bullish momentum; larger red bars indicate stronger bearish momentum.
Usage Tips
Combine this oscillator with other indicators or price action analysis to confirm trading signals.
Adjust smoothing and moving average lengths according to your trading timeframe and the asset volatility.
Use proper risk management to filter out potential false signals common in oscillators.
How it works
SuperSmoother Filter: Reduces price noise to provide smoother and more reliable signals than raw data.
Fast and Slow Moving Averages: The fast MA reacts quicker to price changes, while the slow MA indicates longer trends.
Oscillator: The difference between the fast and slow MAs signals shifts in momentum.
Signal Line: A smoothed version of the oscillator used to generate crossovers.
Histogram: Displays the distance between the oscillator and signal line, with color changes indicating bullish or bearish momentum.
Trading Strategy
Buy Signal: When the oscillator crosses above the signal line, it suggests increasing upward momentum, signaling a potential buy opportunity.
Sell Signal: When the oscillator crosses below the signal line, it suggests increasing downward momentum, signaling a potential sell opportunity.
Histogram Size and Color: Larger green bars indicate stronger bullish momentum; larger red bars indicate stronger bearish momentum.
Usage Tips
Combine this oscillator with other indicators or price action analysis to confirm trading signals.
Adjust smoothing and moving average lengths according to your trading timeframe and the asset volatility.
Use proper risk management to filter out potential false signals common in oscillators.
Release Notes
OverviewThe Luminous Glide Momentum Indicator is a sophisticated trend-following tool designed to reduce market noise while maintaining responsiveness to price action. Unlike standard momentum oscillators that rely on raw price data, this script introduces a custom "Glide Smoothing" algorithm to refine the input source before calculating trend deviations.
Technical Logic & Originality
The core of this indicator is the luminousGlide function. This is a custom-calculated adaptive smoothing filter that uses a dynamic alpha-weighted approach
Glide Pre-processing: It applies a specialized smoothing layer ($2.0 / (len + 1)$) to the price source. This mitigates "whipsaw" signals often found in standard EMAs or MACD.
Dual MA Deviation: It calculates the distance between a Fast EMA ($18$) and a Slow EMA ($45$) derived from the Glide-smoothed data, providing a cleaner representation of market momentum.
Signal Correlation: A 22-period Signal Line is applied to the oscillator to identify high-probability trend shifts through histogram crossovers.
Key Features
Noise Reduction: The Luminous Glide filter ensures that the oscillator doesn't react too violently to minor price spikes.
Visual Trend Confirmation: Includes an integrated barcolor feature that colors the main chart candles based on momentum strength (Oscillator vs. Signal Line).
Highly Customizable: Users can adjust the 'Glide' intensity and MA lengths to suit different timeframes, from scalping to swing trading.
How to Use
1.Bullish Setup: Look for the Blue Oscillator line to cross above the Fuchsia Signal Line while the Histogram turns Teal.
2.Bearish Setup: Look for the Blue Oscillator line to cross below the Fuchsia Signal Line while the Histogram turns Orange.
3.Candle Confirmation: If 'Enable Candle Coloring' is on, green candles represent a confirmed bullish momentum phase.
Release Notes
Title: Luminous Glide Volume Suite [wjdtks255][Description / 설명]
ENG: Luminous Glide Volume Suite is a next-generation trading analysis tool that combines proprietary Glide smoothing technology with volume data analysis. It effectively removes price noise to capture the essence of trends.
KOR: Luminous Glide Volume Suite는 독자적인 Glide 평활화 기술과 거래량 분석을 결합한 차세대 트레이딩 분석 수트입니다. 가격의 노이즈를 효과적으로 제거하여 추세의 본질적인 흐름을 포착합니다.
Key Features / 주요 특징:
Glide Smooth Engine: Filters out unnecessary price noise to reveal clean trend flows. / 불필요한 가격 잔파동을 제거하여 매끄러운 추세 흐름을 도출합니다.
Volume-Driven Momentum: Integrates volume analysis to verify the strength of momentum. / 거래량 데이터를 통합 분석하여 모멘텀의 실시간 신뢰도를 검증합니다.
Smart Entry Signals: Provides strategic entry points by combining smooth oscillator crosses with volume filters to minimize whipsaws. / 부드러운 오실레이터 크로스와 거래량 필터를 결합하여 휩소를 최소화한 전략적 진입 포인트를 제시합니다.
Open-source script
In true TradingView spirit, the creator of this script has made it open-source, so that traders can review and verify its functionality. Kudos to the author! While you can use it for free, remember that republishing the code is subject to our House Rules.

Disclaimer
The information and publications are not meant to be, and do not constitute, financial, investment, trading, or other types of advice or recommendations supplied or endorsed by TradingView. Read more in the Terms of Use.
Open-source script
In true TradingView spirit, the creator of this script has made it open-source, so that traders can review and verify its functionality. Kudos to the author! While you can use it for free, remember that republishing the code is subject to our House Rules.
Disclaimer
The information and publications are not meant to be, and do not constitute, financial, investment, trading, or other types of advice or recommendations supplied or endorsed by TradingView. Read more in the Terms of Use.