Anchored VWAP Bands - Band Reaction Statistics [Dots3Red]
📐 ANCHORED VWAP BANDS - BAND REACTION STATISTICS [Dots3Red]
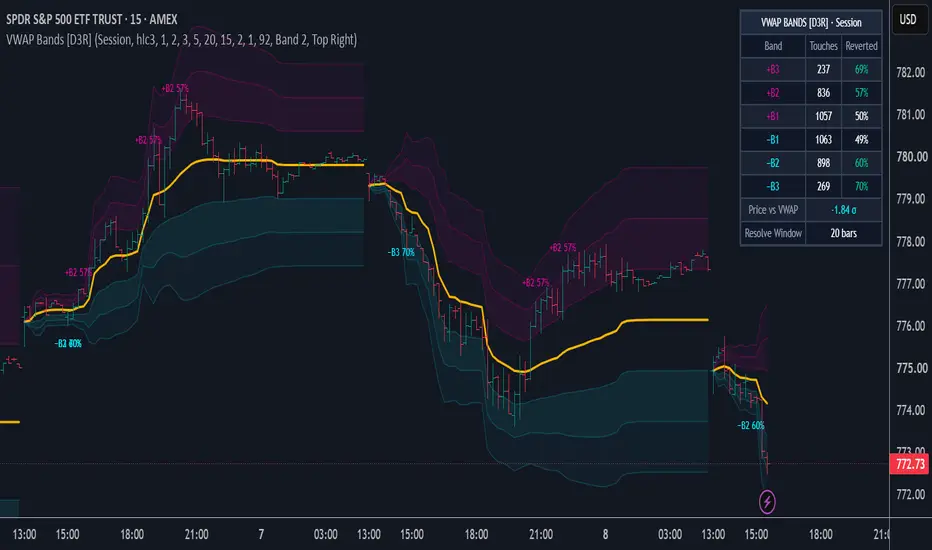
This indicator draws an anchored VWAP (session, week or month) with three pairs of standard-deviation bands, and measures how often price pulled back toward VWAP after touching each band on the current chart, shown as a percentage with the sample size next to it.
✨ WHY THIS MATTERS
VWAP bands are one of the most common intraday tools: many traders fade the outer bands and expect a return toward VWAP. Whether that actually happens depends heavily on the instrument and timeframe. On some charts a 2σ touch snaps back most of the time; on trending charts the same touch often keeps running. Instead of assuming the band "should" hold, this script keeps score of what each band has actually done on your chart.
⚙️ HOW IT WORKS
📐 Anchored VWAP — the volume-weighted average price restarts at the beginning of each session, week or month. Lines break cleanly at each reset so periods don't blur together.
📏 Sigma bands — three upper and three lower bands at configurable multiples of the volume-weighted standard deviation (defaults 1σ, 2σ, 3σ).
🎯 First-touch grading — a touch is the first bar whose wick reaches a band after being inside it on the previous bar. From the next bar on, it is graded against levels frozen at the moment of the touch:
• Reverted — price reaches the next inner level first (band 2 → band 1, band 1 → VWAP)
• Failed — price reaches the next outer level first, or the resolve window runs out
If both happen on the same bar, it counts as failed (the conservative choice).
⏳ Early-period filter — right after each reset the bands are very narrow, so touches in the first few bars of a period are not graded.
🔒 Non-repainting grading — touches are registered and graded on confirmed bars only, using levels as they stood at the time. The VWAP and bands themselves update live on the forming bar, as VWAP always does.
🖥️ Dashboard — touches and reversion rate for each of the six bands, price's current distance from VWAP in σ, and the resolve window.
🧭 HOW TO USE
1️⃣ Let the sample build. Each band shows "Collecting…" until it has enough graded touches. Outer bands are touched less often, so they fill more slowly.
2️⃣ Compare bands, not just one number. A chart where 1σ touches revert often but 3σ touches rarely do is telling you that extended moves tend to keep going there.
3️⃣ Compare upper vs lower. On trending instruments the two sides often behave very differently, for example lower-band touches reverting far more often than upper-band touches in an uptrend.
4️⃣ Match the anchor to your holding period. Session VWAP for intraday trades, weekly or monthly VWAP for swing context.
5️⃣ Use it as context, not a trigger. The rates describe how price has behaved at these bands on this chart. They do not predict the next touch.
⏱️ WHICH TIMEFRAMES WORK BEST
Session-anchored VWAP is designed for intraday charts, 1-minute through 1-hour. Weekly and monthly anchors work well on 15-minute through 4-hour charts. On a daily chart a session anchor restarts every bar and is not meaningful.
🛠️ SETTINGS
📐 VWAP & Bands — anchor period, source, three band multipliers, bars to ignore after each reset
🎯 Band Reaction Grading — max bars to resolve a touch, minimum touches to show a rate
🎨 Visuals — VWAP color and thickness, upper/lower band colors and thickness, show band 3, band fills and transparency, touch labels and which band they start from
🖥️ Dashboard — show/hide, position
🔔 Alerts — upper band 2 touch, lower band 2 touch, VWAP cross
📝 NOTES
VWAP requires volume data. On symbols where the data feed provides no volume, VWAP cannot be calculated. All rates are specific to this chart, timeframe, anchor and settings, and do not transfer to other instruments or configurations.
⚠️ DISCLAIMER
This is an analytical and visualization tool. It does not generate trade signals and does not constitute financial advice. Historical statistics do not guarantee future performance.
This indicator draws an anchored VWAP (session, week or month) with three pairs of standard-deviation bands, and measures how often price pulled back toward VWAP after touching each band on the current chart, shown as a percentage with the sample size next to it.
✨ WHY THIS MATTERS
VWAP bands are one of the most common intraday tools: many traders fade the outer bands and expect a return toward VWAP. Whether that actually happens depends heavily on the instrument and timeframe. On some charts a 2σ touch snaps back most of the time; on trending charts the same touch often keeps running. Instead of assuming the band "should" hold, this script keeps score of what each band has actually done on your chart.
⚙️ HOW IT WORKS
📐 Anchored VWAP — the volume-weighted average price restarts at the beginning of each session, week or month. Lines break cleanly at each reset so periods don't blur together.
📏 Sigma bands — three upper and three lower bands at configurable multiples of the volume-weighted standard deviation (defaults 1σ, 2σ, 3σ).
🎯 First-touch grading — a touch is the first bar whose wick reaches a band after being inside it on the previous bar. From the next bar on, it is graded against levels frozen at the moment of the touch:
• Reverted — price reaches the next inner level first (band 2 → band 1, band 1 → VWAP)
• Failed — price reaches the next outer level first, or the resolve window runs out
If both happen on the same bar, it counts as failed (the conservative choice).
⏳ Early-period filter — right after each reset the bands are very narrow, so touches in the first few bars of a period are not graded.
🔒 Non-repainting grading — touches are registered and graded on confirmed bars only, using levels as they stood at the time. The VWAP and bands themselves update live on the forming bar, as VWAP always does.
🖥️ Dashboard — touches and reversion rate for each of the six bands, price's current distance from VWAP in σ, and the resolve window.
🧭 HOW TO USE
1️⃣ Let the sample build. Each band shows "Collecting…" until it has enough graded touches. Outer bands are touched less often, so they fill more slowly.
2️⃣ Compare bands, not just one number. A chart where 1σ touches revert often but 3σ touches rarely do is telling you that extended moves tend to keep going there.
3️⃣ Compare upper vs lower. On trending instruments the two sides often behave very differently, for example lower-band touches reverting far more often than upper-band touches in an uptrend.
4️⃣ Match the anchor to your holding period. Session VWAP for intraday trades, weekly or monthly VWAP for swing context.
5️⃣ Use it as context, not a trigger. The rates describe how price has behaved at these bands on this chart. They do not predict the next touch.
⏱️ WHICH TIMEFRAMES WORK BEST
Session-anchored VWAP is designed for intraday charts, 1-minute through 1-hour. Weekly and monthly anchors work well on 15-minute through 4-hour charts. On a daily chart a session anchor restarts every bar and is not meaningful.
🛠️ SETTINGS
📐 VWAP & Bands — anchor period, source, three band multipliers, bars to ignore after each reset
🎯 Band Reaction Grading — max bars to resolve a touch, minimum touches to show a rate
🎨 Visuals — VWAP color and thickness, upper/lower band colors and thickness, show band 3, band fills and transparency, touch labels and which band they start from
🖥️ Dashboard — show/hide, position
🔔 Alerts — upper band 2 touch, lower band 2 touch, VWAP cross
📝 NOTES
VWAP requires volume data. On symbols where the data feed provides no volume, VWAP cannot be calculated. All rates are specific to this chart, timeframe, anchor and settings, and do not transfer to other instruments or configurations.
⚠️ DISCLAIMER
This is an analytical and visualization tool. It does not generate trade signals and does not constitute financial advice. Historical statistics do not guarantee future performance.

Connect the dots to elevate your trading.
Disclaimer
The information and publications are not meant to be, and do not constitute, financial, investment, trading, or other types of advice or recommendations supplied or endorsed by TradingView. Read more in the Terms of Use.
Connect the dots to elevate your trading.
Disclaimer
The information and publications are not meant to be, and do not constitute, financial, investment, trading, or other types of advice or recommendations supplied or endorsed by TradingView. Read more in the Terms of Use.