OPEN-SOURCE SCRIPT
Balance Point
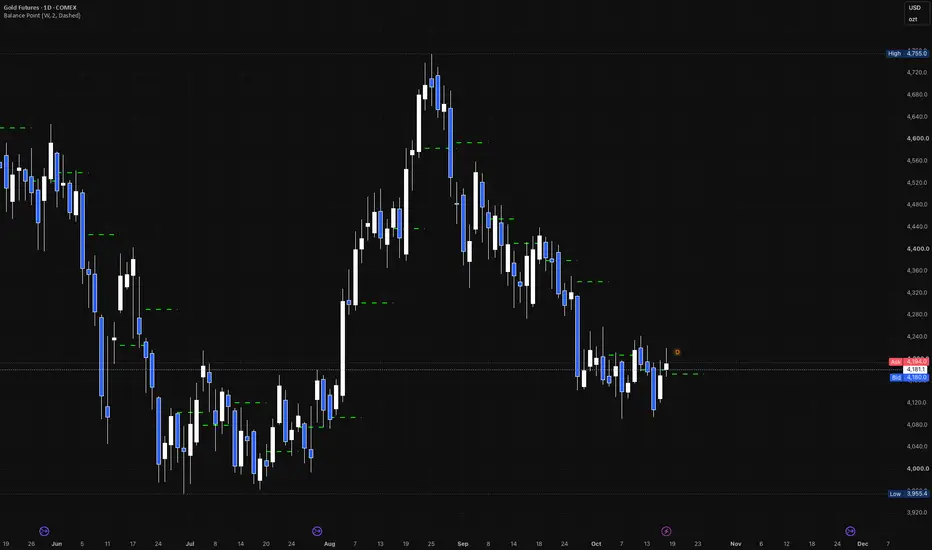
Balance Point draws the average of a higher-timeframe period's high, low and close, (H + L + C) / 3, across the following period, and projects the current period's value one period ahead.
HOW IT WORKS
Each period shows the previous period's Balance Point as a flat line. It is fixed once that period closes and never changes.
The current period's Balance Point (its high, low and close so far) is drawn one period wide to the right of the last bar, where it will apply next period. It updates live until the period closes.
HOW TO USE IT
Price above the line leans bullish for the period; below it, bearish.
A test of the line from above or below is a place to watch for support or resistance.
The projected line shows where next period's Balance Point stands right now.
INPUTS
Timeframe: the period the Balance Point is calculated on (W). The chart's own timeframe works too: each bar then shows the previous bar's value.
Line Color, Line Width, Line Style: the look of the lines (green, 2, Dashed).
DRAWING AND LIMITATIONS
Drawn only on charts at or below the chosen timeframe; on a higher chart nothing is drawn.
Past lines use closed periods only. The projected line is the current period so far and changes until the period closes.
About the last 500 periods keep their lines.
CREDITS
Balance Point as described by Robert Krausz.
Open-source script
In true TradingView spirit, the creator of this script has made it open-source, so that traders can review and verify its functionality. Kudos to the author! While you can use it for free, remember that republishing the code is subject to our House Rules.

Disclaimer
The information and publications are not meant to be, and do not constitute, financial, investment, trading, or other types of advice or recommendations supplied or endorsed by TradingView. Read more in the Terms of Use.
Open-source script
In true TradingView spirit, the creator of this script has made it open-source, so that traders can review and verify its functionality. Kudos to the author! While you can use it for free, remember that republishing the code is subject to our House Rules.
Disclaimer
The information and publications are not meant to be, and do not constitute, financial, investment, trading, or other types of advice or recommendations supplied or endorsed by TradingView. Read more in the Terms of Use.