OPEN-SOURCE SCRIPT
RSI + SMA Crossover Gradient MTF Table
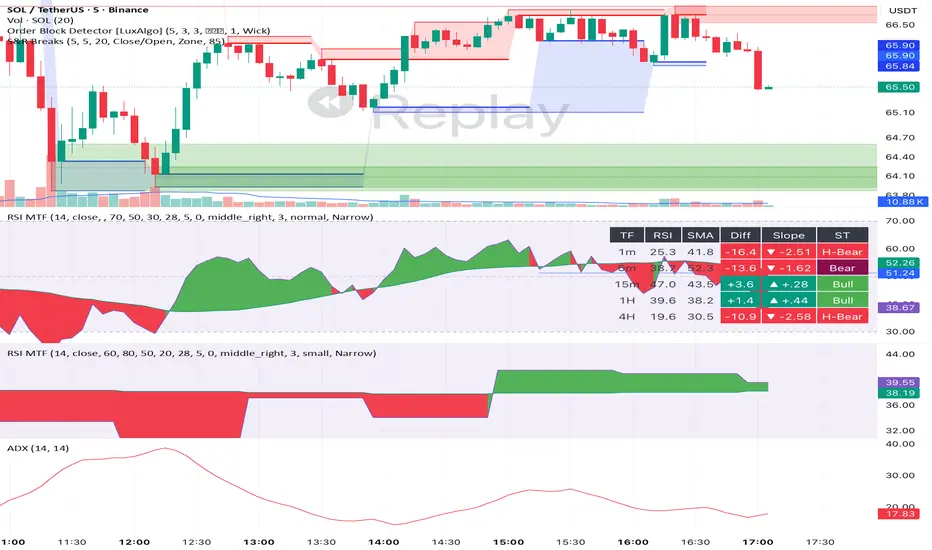
A multi-timeframe RSI indicator with SMA smoothing, crossover gradient fill, and a live MTF table.
FEATURES:
- RSI with custom SMA smoothing line
- Crossover Gradient Fill — color darkens as RSI moves away from cross point (bullish/bearish)
- MTF Table showing 1m, 5m, 15m, 1H, 4H timeframes simultaneously
- Each row shows: RSI value, SMA value, Diff (RSI−SMA), Slope direction, and Market State
- Market States: H-Bull, Bull, Bear, H-Bear based on RSI/SMA position relative to 50
- Table size adjustable (tiny to huge) — mobile friendly
- Table position fully customizable
HOW TO USE:
- RSI above SMA = Bullish momentum (green gradient)
- RSI below SMA = Bearish momentum (red gradient)
- H-Bull = Strong bull (both RSI & SMA above 50)
- H-Bear = Strong bear (both RSI & SMA below 50)
- Use MTF table to confirm trend across timeframes before entering a trade
FEATURES:
- RSI with custom SMA smoothing line
- Crossover Gradient Fill — color darkens as RSI moves away from cross point (bullish/bearish)
- MTF Table showing 1m, 5m, 15m, 1H, 4H timeframes simultaneously
- Each row shows: RSI value, SMA value, Diff (RSI−SMA), Slope direction, and Market State
- Market States: H-Bull, Bull, Bear, H-Bear based on RSI/SMA position relative to 50
- Table size adjustable (tiny to huge) — mobile friendly
- Table position fully customizable
HOW TO USE:
- RSI above SMA = Bullish momentum (green gradient)
- RSI below SMA = Bearish momentum (red gradient)
- H-Bull = Strong bull (both RSI & SMA above 50)
- H-Bear = Strong bear (both RSI & SMA below 50)
- Use MTF table to confirm trend across timeframes before entering a trade
Open-source script
In true TradingView spirit, the creator of this script has made it open-source, so that traders can review and verify its functionality. Kudos to the author! While you can use it for free, remember that republishing the code is subject to our House Rules.

Disclaimer
The information and publications are not meant to be, and do not constitute, financial, investment, trading, or other types of advice or recommendations supplied or endorsed by TradingView. Read more in the Terms of Use.
Open-source script
In true TradingView spirit, the creator of this script has made it open-source, so that traders can review and verify its functionality. Kudos to the author! While you can use it for free, remember that republishing the code is subject to our House Rules.
Disclaimer
The information and publications are not meant to be, and do not constitute, financial, investment, trading, or other types of advice or recommendations supplied or endorsed by TradingView. Read more in the Terms of Use.