OPEN-SOURCE SCRIPT
ADR Range Meter [Indicatr]
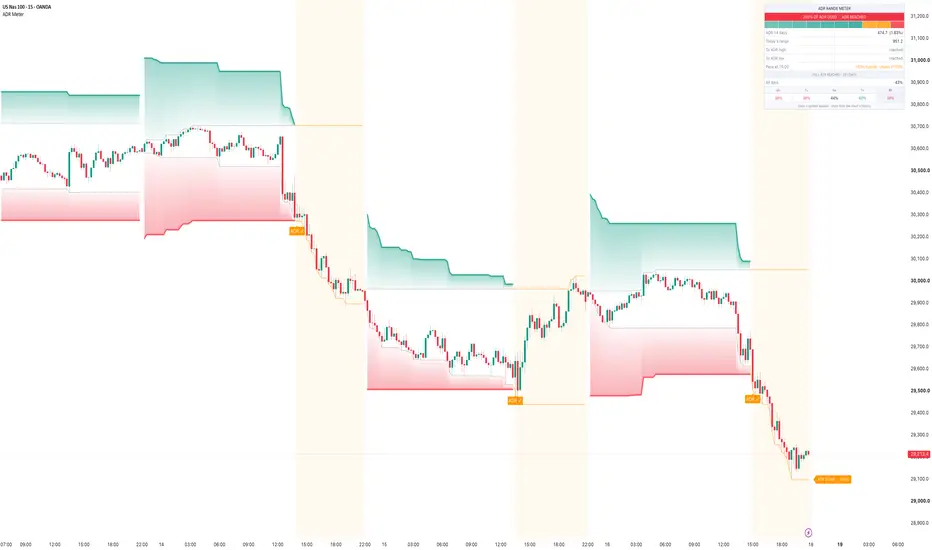
ADR Range Meter shows how much of its average daily range (ADR) a market has already used today, where the day would end if it ran a full ADR from here, and whether today is moving faster or slower than a typical day at this time. It also counts how often each weekday actually reached its ADR on the symbol you are looking at. Built for intraday charts from 1 minute to 4 hours, on any market.
⬤ WHAT YOU SEE ON THE CHART
⬤ HOW IT WORKS
⬤ HOW TO USE
⬤ DASHBOARD
Status banner with the share of the ADR used and a ten-segment gauge, ADR in price and percent, today's range, distance to both targets, the pace comparison, and the share of days that reached a full ADR, overall and per weekday. Theme Auto / Light / Dark, position and text size can be changed.
⬤ SETTINGS
ADR length, day boundary, warning level, ADR targets, shading, today's high and low, ADR ✓ marker, optional 150% extension, tint after the ADR is used up, price labels and colours.
⬤ ALERTS
Warning level reached and full ADR reached, both once per day.
⬤ LIMITATIONS
⬤ DISCLAIMER
For educational and analytical purposes only. Not financial advice. Trading involves risk of loss.
⬤ WHAT YOU SEE ON THE CHART
- ADR targets: the upper target is today's low plus the ADR, the lower target is today's high minus the ADR. Both are drawn as glowing lines that close in on price while the day develops, so every day forms a funnel.
- Room left: a gradient between today's high and the upper target (and today's low and the lower target). It is strongest at the target and fades towards price. A large green area means plenty of room up, a thin one means the day is nearly done.
- Today's high and low as thin lines. They turn orange once the full ADR has been used.
- ADR ✓ marker on the bar that completes the full ADR, placed on the side that did it.
- Orange tint for the rest of a day once its ADR is used up.
- Price labels at the last bar: ADR HIGH and ADR LOW with the distance from the current price, or ADR DONE with the share used.
⬤ HOW IT WORKS
- Daily ranges from the chart's own bars. No request.security call. By default a day is the symbol's own trading session, so the days match the symbol's daily candles (for forex and CFDs the day starts at 17:00 New York). Alternatively the day can be cut at midnight in exchange time, UTC, New York, London or Berlin.
- ADR is the average high-low range of the last completed days (default 14).
- Usage is today's range divided by the ADR. Below the warning level (default 75%) the meter is green, from the warning level orange, and red at 100% or more.
- Pace: for every hour since the day started, the script stores which share of the final day range had been reached by then, and averages this over the chart's history. Today's usage is compared with that typical value: "ahead +20%" means today has covered 20 percentage points more of its ADR than a typical day by this hour.
- Weekday hit rate: for every completed day, the script checks whether its range reached the ADR known at the start of that day, and counts this per weekday.
⬤ HOW TO USE
- Late in the range (orange or red), a breakout in the direction of the move has less room left. Many traders prefer to take profits near a target or wait for a pullback instead of chasing.
- Early in the range with a wide funnel, there is statistically more room for the day to extend.
- The pace row shows whether today is a fast or a slow day compared with the usual rhythm of this market.
- The weekday row shows on which days a full ADR is common and on which it is the exception.
- The ADR is an average, not a limit. Trend days regularly run 150% or more, so use it as context together with your own levels.
⬤ DASHBOARD
Status banner with the share of the ADR used and a ten-segment gauge, ADR in price and percent, today's range, distance to both targets, the pace comparison, and the share of days that reached a full ADR, overall and per weekday. Theme Auto / Light / Dark, position and text size can be changed.
⬤ SETTINGS
ADR length, day boundary, warning level, ADR targets, shading, today's high and low, ADR ✓ marker, optional 150% extension, tint after the ADR is used up, price labels and colours.
⬤ ALERTS
Warning level reached and full ADR reached, both once per day.
⬤ LIMITATIONS
- The statistics use the history loaded on your chart. On lower timeframes this may only be a few months.
- Shortened sessions (holidays) count as normal days and can lower the ADR slightly.
- On a daily or higher chart the script shows a note and draws nothing.
⬤ DISCLAIMER
For educational and analytical purposes only. Not financial advice. Trading involves risk of loss.
Open-source script
In true TradingView spirit, the creator of this script has made it open-source, so that traders can review and verify its functionality. Kudos to the author! While you can use it for free, remember that republishing the code is subject to our House Rules.

Indicatr - the indicators you know, rebuilt with market context: volume, trend and momentum, for long and short. Free open-source tools and Pro tools. Guides and setups: indicator.trading/en/link
Disclaimer
The information and publications are not meant to be, and do not constitute, financial, investment, trading, or other types of advice or recommendations supplied or endorsed by TradingView. Read more in the Terms of Use.
Open-source script
In true TradingView spirit, the creator of this script has made it open-source, so that traders can review and verify its functionality. Kudos to the author! While you can use it for free, remember that republishing the code is subject to our House Rules.
Indicatr - the indicators you know, rebuilt with market context: volume, trend and momentum, for long and short. Free open-source tools and Pro tools. Guides and setups: indicator.trading/en/link
Disclaimer
The information and publications are not meant to be, and do not constitute, financial, investment, trading, or other types of advice or recommendations supplied or endorsed by TradingView. Read more in the Terms of Use.