OPEN-SOURCE SCRIPT
Volatility Halo | NAL
1. Overview
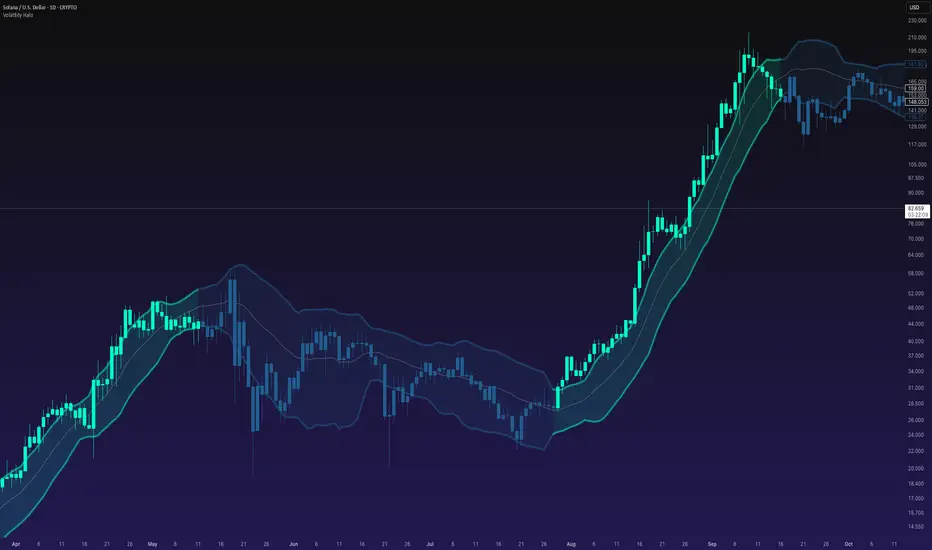
Volatility Halo | NAL is an adaptive volatility band indicator built from a Zero-Lag EMA baseline, ATR band structure, and a recursive GARCH-style volatility regime multiplier.
The indicator does not use fixed-width bands. Instead, it starts with ATR-based bands and then adjusts their width using a projected volatility regime model. This allows the bands to respond differently when market volatility is expanding, contracting, or stabilizing.
2. Calculation
The indicator starts by calculating a Zero-Lag EMA baseline from the selected source. This baseline acts as the central trend reference, helping reduce lag compared to a standard EMA while still keeping the structure smooth.
Pine Script®
The ATR value is then multiplied by the user-defined ATR multiple. This forms the base volatility distance used for the upper and lower bands.
The more advanced part of the indicator is the recursive GARCH-style regime multiplier. It begins by calculating log returns and converting them into shock variance. A long-run variance estimate is then built from recent shock variance.
Pine Script®
The model recursively updates conditional variance using three components: recent shock variance, long-run variance, and previous conditional variance. When adaptive coefficients are enabled, the script searches for coefficient weights that better fit recent variance behavior.
Pine Script®
The conditional variance is then projected and converted into a volatility estimate. This volatility is compared against its own regime baseline to create a volatility regime multiplier. The multiplier is clamped between a minimum and maximum value, preventing the bands from becoming too narrow or too wide.
Pine Script®
The final band width is created by combining ATR with the GARCH regime multiplier. The upper and lower bands are placed around the Zero-Lag EMA baseline.
Pine Script®
A bullish state triggers when price closes above the upper band. A bearish state triggers when price closes below the lower band. When price remains inside the bands, the previous state is held.
3. Key Features
4. Use
Volatility Halo is designed to identify moments where price begins escaping its volatility-adjusted structure. A close above the upper band reflects bullish expansion, while a close below the lower band reflects bearish expansion.
The adaptive volatility engine allows the bands to shift with the underlying market environment, making the signal more responsive to changes in pressure and regime.
This indicator is best used as a specialized module within a complete strategy framework. Its real strength appears when it is combined with a broader process for reading market behavior, timing, and risk. The full edge comes from how the signal is integrated, not from the signal existing in isolation.
Volatility Halo | NAL is an adaptive volatility band indicator built from a Zero-Lag EMA baseline, ATR band structure, and a recursive GARCH-style volatility regime multiplier.
The indicator does not use fixed-width bands. Instead, it starts with ATR-based bands and then adjusts their width using a projected volatility regime model. This allows the bands to respond differently when market volatility is expanding, contracting, or stabilizing.
2. Calculation
The indicator starts by calculating a Zero-Lag EMA baseline from the selected source. This baseline acts as the central trend reference, helping reduce lag compared to a standard EMA while still keeping the structure smooth.
float baseline = f_zlema(src, baseline_len)
float ATR_Value = ta.atr(ATR_Len)
The ATR value is then multiplied by the user-defined ATR multiple. This forms the base volatility distance used for the upper and lower bands.
The more advanced part of the indicator is the recursive GARCH-style regime multiplier. It begins by calculating log returns and converting them into shock variance. A long-run variance estimate is then built from recent shock variance.
GARCH_LogReturn = close > 0.0 and close[1] > 0.0 ? math.log(close / close[1]) : 0.0
GARCH_ShockVariance = math.pow(GARCH_LogReturn, 2.0)
GARCH_LongRunVariance = ta.ema(GARCH_ShockVariance, GARCH_LongRunLen)
The model recursively updates conditional variance using three components: recent shock variance, long-run variance, and previous conditional variance. When adaptive coefficients are enabled, the script searches for coefficient weights that better fit recent variance behavior.
GARCH_ConditionalVariance :=
GARCH_Gamma * GARCH_LongRunVariance +
GARCH_Alpha * GARCH_ShockVariance +
GARCH_Beta * GARCH_PreviousConditionalVariance
The conditional variance is then projected and converted into a volatility estimate. This volatility is compared against its own regime baseline to create a volatility regime multiplier. The multiplier is clamped between a minimum and maximum value, preventing the bands from becoming too narrow or too wide.
GARCH_Volatility = math.sqrt(math.max(GARCH_ProjectedVariance, 0.0))
GARCH_RegimeMultiplierRaw = GARCH_Volatility / GARCH_RegimeBase
GARCH_RegimeMultiplier = f_clamp(GARCH_RegimeMultiplierSmooth, GARCH_MinMult, GARCH_MaxMult)
The final band width is created by combining ATR with the GARCH regime multiplier. The upper and lower bands are placed around the Zero-Lag EMA baseline.
hybridBandWidth = ATR_Value * ATR_Mult * GARCH_RegimeMultiplier
upperBand = baseline + hybridBandWidth
lowerBand = baseline - hybridBandWidth
A bullish state triggers when price closes above the upper band. A bearish state triggers when price closes below the lower band. When price remains inside the bands, the previous state is held.
3. Key Features
- Zero-Lag EMA baseline for reduced-lag trend structure.
- ATR-based volatility bands.
- Recursive GARCH-style conditional variance model.
- Adaptive volatility regime multiplier.
- Bands expand or contract based on projected volatility conditions.
- State-based candle coloring, band coloring, glow effect, and regime fills.
4. Use
Volatility Halo is designed to identify moments where price begins escaping its volatility-adjusted structure. A close above the upper band reflects bullish expansion, while a close below the lower band reflects bearish expansion.
The adaptive volatility engine allows the bands to shift with the underlying market environment, making the signal more responsive to changes in pressure and regime.
This indicator is best used as a specialized module within a complete strategy framework. Its real strength appears when it is combined with a broader process for reading market behavior, timing, and risk. The full edge comes from how the signal is integrated, not from the signal existing in isolation.
Open-source script
In true TradingView spirit, the creator of this script has made it open-source, so that traders can review and verify its functionality. Kudos to the author! While you can use it for free, remember that republishing the code is subject to our House Rules.

Disclaimer
The information and publications are not meant to be, and do not constitute, financial, investment, trading, or other types of advice or recommendations supplied or endorsed by TradingView. Read more in the Terms of Use.
Open-source script
In true TradingView spirit, the creator of this script has made it open-source, so that traders can review and verify its functionality. Kudos to the author! While you can use it for free, remember that republishing the code is subject to our House Rules.
Disclaimer
The information and publications are not meant to be, and do not constitute, financial, investment, trading, or other types of advice or recommendations supplied or endorsed by TradingView. Read more in the Terms of Use.