OPEN-SOURCE SCRIPT
ATK/DEF Hyper Candle Context | Price Action Analyzer
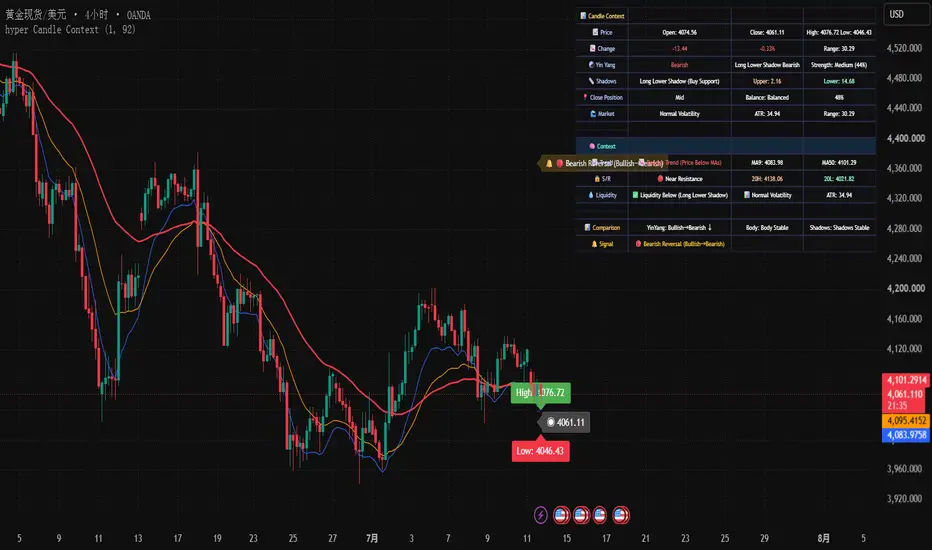
Hyper Candle Context is a comprehensive price action analysis tool to traders learning candle structure, market behavior, and current chart context through a multi-layer analytical dashboard.
This indicator focuses on pure price action observation by analyzing candle formation, including candle body strength, candle range, upper and lower wick behavior, closing position, volatility condition, and short-term market structure.
Unlike traditional indicators that rely mainly on mathematical oscillators, Hyper Candle Context focuses on reading the information contained inside each candle and presenting it in a structured way.
Candle Structure Analysis
The indicator evaluates candle characteristics through:
• Candle body size and strength
• Body-to-range percentage relationship
• Bullish and bearish candle balance
• Upper shadow and lower shadow analysis
• Doji and neutral candle identification
• Candle expansion and contraction behavior
These measurements provide a clearer understanding of how price is moving within each candle.
Price Action Context
Hyper Candle Context compares current candle behavior with previous candle information to highlight changes in market behavior:
• Bullish and bearish candle transitions
• Body strength changes
• Shadow development
• Momentum changes between candles
• Increasing or decreasing price pressure
This allows users to observe the evolution of candle behavior instead of looking at isolated candles.
Market Condition Analysis
The indicator includes market environment analysis using price volatility and range behavior:
• Current candle range compared with ATR volatility
• Narrow and expanding market conditions
• Volatility increase or decrease
• Market compression observation
This helps users understand whether the market is experiencing low activity, normal movement, or increased volatility.
Trend and Market Context
Additional context is provided through optional moving averages:
• EMA 9
• EMA 21
• EMA 50
The indicator displays the relationship between price and moving averages to help users observe general market alignment.
Support, Resistance and Liquidity Observation
The script monitors recent price areas and candle reactions:
• Recent high and low zones
• Potential support and resistance areas
• Upper wick rejection areas
• Lower wick reaction areas
• Liquidity-related candle behavior
These features are designed to assist manual chart analysis and market observation.
Information Dashboard
The built-in dashboard displays multiple layers of candle information:
• price data
• Candle direction
• Candle strength classification
• Candle pattern description
• Shadow condition
• Closing position
• Market volatility state
• Trend context
• Support and resistance context
• Liquidity observation
• Previous candle comparison
All information is organized into a visual dashboard for easier chart interpretation.
Designed For
Hyper Candle Context is designed for traders who learning:
• Price Action
• Candlestick analysis
• Market structure
• Volatility behavior
• Chart context
The indicator is intended as a visual analysis assistant to support independent market research and decision-making.
Important Notes
Hyper Candle Context does not provide trad decisions, outcomes, or advice.
It is a price action analysis tool designed to help users better understand current market information and develop their own interpretation of price behavior.
This indicator focuses on pure price action observation by analyzing candle formation, including candle body strength, candle range, upper and lower wick behavior, closing position, volatility condition, and short-term market structure.
Unlike traditional indicators that rely mainly on mathematical oscillators, Hyper Candle Context focuses on reading the information contained inside each candle and presenting it in a structured way.
Candle Structure Analysis
The indicator evaluates candle characteristics through:
• Candle body size and strength
• Body-to-range percentage relationship
• Bullish and bearish candle balance
• Upper shadow and lower shadow analysis
• Doji and neutral candle identification
• Candle expansion and contraction behavior
These measurements provide a clearer understanding of how price is moving within each candle.
Price Action Context
Hyper Candle Context compares current candle behavior with previous candle information to highlight changes in market behavior:
• Bullish and bearish candle transitions
• Body strength changes
• Shadow development
• Momentum changes between candles
• Increasing or decreasing price pressure
This allows users to observe the evolution of candle behavior instead of looking at isolated candles.
Market Condition Analysis
The indicator includes market environment analysis using price volatility and range behavior:
• Current candle range compared with ATR volatility
• Narrow and expanding market conditions
• Volatility increase or decrease
• Market compression observation
This helps users understand whether the market is experiencing low activity, normal movement, or increased volatility.
Trend and Market Context
Additional context is provided through optional moving averages:
• EMA 9
• EMA 21
• EMA 50
The indicator displays the relationship between price and moving averages to help users observe general market alignment.
Support, Resistance and Liquidity Observation
The script monitors recent price areas and candle reactions:
• Recent high and low zones
• Potential support and resistance areas
• Upper wick rejection areas
• Lower wick reaction areas
• Liquidity-related candle behavior
These features are designed to assist manual chart analysis and market observation.
Information Dashboard
The built-in dashboard displays multiple layers of candle information:
• price data
• Candle direction
• Candle strength classification
• Candle pattern description
• Shadow condition
• Closing position
• Market volatility state
• Trend context
• Support and resistance context
• Liquidity observation
• Previous candle comparison
All information is organized into a visual dashboard for easier chart interpretation.
Designed For
Hyper Candle Context is designed for traders who learning:
• Price Action
• Candlestick analysis
• Market structure
• Volatility behavior
• Chart context
The indicator is intended as a visual analysis assistant to support independent market research and decision-making.
Important Notes
Hyper Candle Context does not provide trad decisions, outcomes, or advice.
It is a price action analysis tool designed to help users better understand current market information and develop their own interpretation of price behavior.
Open-source script
In true TradingView spirit, the creator of this script has made it open-source, so that traders can review and verify its functionality. Kudos to the author! While you can use it for free, remember that republishing the code is subject to our House Rules.

Disclaimer
The information and publications are not meant to be, and do not constitute, financial, investment, trading, or other types of advice or recommendations supplied or endorsed by TradingView. Read more in the Terms of Use.
Open-source script
In true TradingView spirit, the creator of this script has made it open-source, so that traders can review and verify its functionality. Kudos to the author! While you can use it for free, remember that republishing the code is subject to our House Rules.
Disclaimer
The information and publications are not meant to be, and do not constitute, financial, investment, trading, or other types of advice or recommendations supplied or endorsed by TradingView. Read more in the Terms of Use.