[DAOL] Trend Mileage
⏺️ What is it?
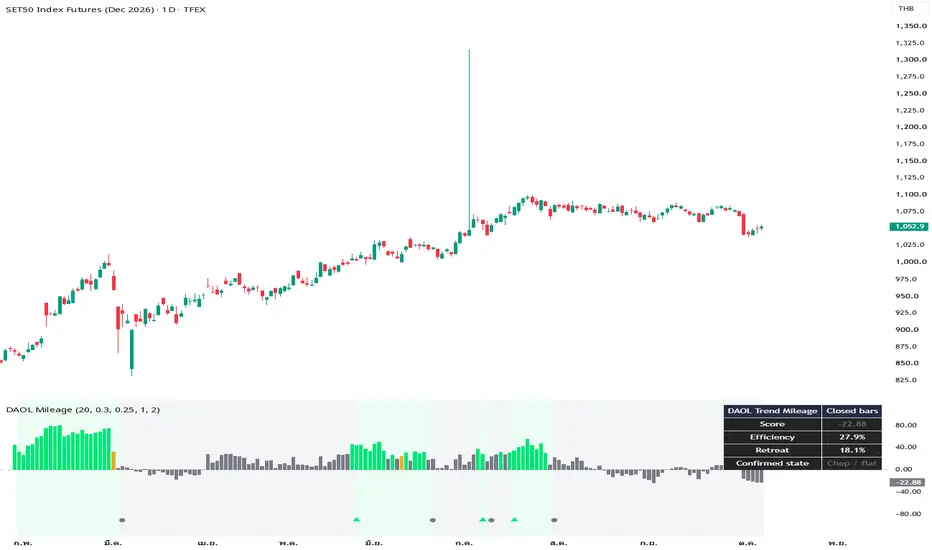
[DAOL] Trend Mileage measures how efficiently price moves in one direction, then reduces its score when price retreats from the closing-price extreme within the selected window.
The idea is simple: if the total distance between consecutive closes is 10 points, but the net advance is only 2 points, price has moved a lot while making relatively little progress.
The indicator combines three elements:
🔹 Efficiency — net price change compared with total close-to-close movement
🔹 Direction — whether the current close is above or below the close N bars ago
🔹 Retreat — how far price has pulled back from the highest close, or rebounded from the lowest close, within the same window
The resulting score ranges from −100 to +100. Its sign indicates direction, while its magnitude represents movement efficiency after the retreat penalty.
⏺️ Indicator นี้คืออะไร?
[DAOL] Trend Mileage คือเครื่องมือวัดว่า ราคาเคลื่อนไหวอย่างมีทิศทางได้มีประสิทธิภาพแค่ไหน แล้วลดคะแนนเมื่อราคาถอยกลับจากจุดสุดขั้วของราคาปิดในช่วงที่กำหนด
หลักการเข้าใจง่าย: หากราคาปิดแต่ละแท่งเดินทางรวม 10 จุด แต่ขึ้นสุทธิเพียง 2 จุด แสดงว่าราคาเคลื่อนไหวมาก แต่เดินหน้าได้น้อย
Indicator ประเมินจาก 3 องค์ประกอบ:
🔹 Efficiency — ระยะเปลี่ยนแปลงสุทธิ เทียบกับระยะเคลื่อนไหวรวมระหว่างราคาปิดแต่ละแท่ง
🔹 Direction — ราคาปิดปัจจุบันสูงหรือต่ำกว่าราคาปิดเมื่อ N แท่งก่อน
🔹 Retreat — ราคาถอยจากราคาปิดสูงสุด หรือเด้งจากราคาปิดต่ำสุดในกรอบเดียวกันมากแค่ไหน
คะแนนอยู่ระหว่าง −100 ถึง +100 โดยเครื่องหมายบอกทิศทาง ส่วนขนาดคะแนนบอกประสิทธิภาพการเคลื่อนไหวหลังหักการถอยกลับ
คะแนนนี้ ไม่ใช่เปอร์เซ็นต์โอกาสชนะ
⏺️ Why use Trend Mileage?
🔹 Distinguishes directional progress from back-and-forth price movement
🔹 Adds context when price remains directional but has already given back part of its move
🔹 Provides a consistent scale for observing changes in market conditions
🔹 Helps complement price action, support/resistance, and other analytical tools
A positive score alone does not confirm an uptrend, and a negative score alone does not confirm a downtrend. Read the score together with efficiency, retreat, and state classification.
⏺️ ทำไมต้องใช้?
🔹 ช่วยแยกการเดินหน้าอย่างมีทิศทาง ออกจากการแกว่งขึ้นลงไปมา
🔹 ช่วยสังเกตว่าราคายังมีทิศทาง แต่คืนระยะที่เคยเดินหน้าไปแล้วมากเพียงใด
🔹 แสดงผลด้วยสเกลเดียวกัน เพื่อให้ติดตามการเปลี่ยนแปลงของสภาวะราคาได้ง่าย
🔹 ใช้ประกอบการอ่าน Price Action แนวรับ/แนวต้าน และเครื่องมือวิเคราะห์อื่น
คะแนนบวกเพียงอย่างเดียวไม่ได้ยืนยันขาขึ้น และคะแนนลบเพียงอย่างเดียวไม่ได้ยืนยันขาลง ควรอ่านร่วมกับค่า Efficiency, Retreat และสีสถานะ
⏺️ Who should use it?
🔹 Traders who want to assess the quality of directional price movement
🔹 Day traders and swing traders monitoring transitions between directional and choppy conditions
🔹 Technical analysts seeking additional context for price action
🔹 Users who prefer a price-only indicator without a volume-data requirement
⏺️ เหมาะกับใคร?
🔹 Trader ที่ต้องการประเมินคุณภาพของการเคลื่อนไหวอย่างมีทิศทาง
🔹 Day trader และ Swing trader ที่ติดตามการเปลี่ยนจากช่วงมีทิศทางไปสู่ช่วงแกว่งตัว
🔹 นักวิเคราะห์ที่ต้องการข้อมูลเพิ่มเติมประกอบการอ่าน Price Action
🔹 ผู้ใช้ที่ต้องการ Indicator จากราคา โดยไม่ต้องอาศัยข้อมูล Volume
⏺️ How is the score calculated?
Net Move = Current Close − Close N bars ago
Total Distance = Sum of absolute close-to-close changes over N bars
Efficiency Ratio = |Net Move| ÷ Total Distance
Retreat Fraction:
Upward net move: (Highest Close − Current Close) ÷ Closing-Price Range
Downward net move: (Current Close − Lowest Close) ÷ Closing-Price Range
Retained Factor = max(0, 1 − Penalty Weight × Retreat Fraction)
Trend Mileage = 100 × Direction × Efficiency Ratio × Retained Factor
Closing-price extremes use N+1 closes, matching the N price changes used in the efficiency calculation.
If all closes are unchanged, the score is zero.
⏺️ คำนวณอย่างไร?
Net Move = ราคาปิดปัจจุบัน − ราคาปิดเมื่อ N แท่งก่อน
Total Distance = ผลรวมระยะเปลี่ยนแปลงระหว่างราคาปิดแต่ละแท่ง โดยไม่คิดเครื่องหมาย
Efficiency Ratio = ค่าสัมบูรณ์ของ Net Move ÷ Total Distance
Retreat Fraction:
ทิศทางขึ้น: ระยะถอยจากราคาปิดสูงสุด ÷ ช่วงราคาปิดสูงสุด–ต่ำสุด
ทิศทางลง: ระยะเด้งจากราคาปิดต่ำสุด ÷ ช่วงราคาปิดสูงสุด–ต่ำสุด
Retained Factor = max(0, 1 − น้ำหนักการหักคะแนน × Retreat Fraction)
Trend Mileage = 100 × ทิศทาง × Efficiency Ratio × Retained Factor
ใช้ราคาปิด N+1 ค่า เพื่อให้ครอบคลุมระยะเปลี่ยนแปลง N ช่วงอย่างสอดคล้องกัน
หากราคาปิดทั้งหมดไม่เปลี่ยนแปลง คะแนนจะเป็นศูนย์
⏺️ How to read the colors
🟢 Green — positive net movement, efficiency meets the threshold, and retreat remains below the limit
🔴 Red — negative net movement, efficiency meets the threshold, and rebound remains below the limit
🟡 Gold — efficiency meets the threshold, but the pullback or rebound has reached the retreat limit
⚪ Gray — efficiency is below the threshold, or there is no net price change
Colors are classified using efficiency, direction, and retreat—not fixed score bands. A gold bar can appear above or below zero.
⏺️ อ่านสีอย่างไร?
🟢 เขียว — ราคาเปลี่ยนแปลงสุทธิเป็นบวก มี Efficiency ผ่านเกณฑ์ และยังถอยจากราคาปิดสูงสุดไม่ถึงเกณฑ์ที่กำหนด
🔴 แดง — ราคาเปลี่ยนแปลงสุทธิเป็นลบ มี Efficiency ผ่านเกณฑ์ และยังเด้งจากราคาปิดต่ำสุดไม่ถึงเกณฑ์ที่กำหนด
🟡 ทอง — มี Efficiency ผ่านเกณฑ์ แต่ถอยกลับหรือเด้งกลับถึงเกณฑ์ที่กำหนดแล้ว
⚪ เทา — Efficiency ต่ำกว่าเกณฑ์ หรือราคาไม่มีการเปลี่ยนแปลงสุทธิ
สีพิจารณาจาก Efficiency ทิศทาง และ Retreat ไม่ได้แบ่งตามช่วงคะแนนตายตัว สีทองจึงปรากฏได้ทั้งเหนือและใต้เส้นศูนย์
⏺️ How to use
🔹 Histogram — displays the latest closed-bar score and its classification
🔹 Background — displays the confirmed state after the required number of consecutive closed bars
🔹 Markers — identify changes in the confirmed state
🔹 Dashboard — displays score, efficiency, retreat, and confirmed state
A larger absolute score indicates more efficient directional progress with a smaller retreat penalty. It does not necessarily indicate a larger price move.
A shrinking absolute score may reflect lower efficiency, a larger retreat penalty, or both.
The histogram and background may temporarily differ while a new state is waiting for confirmation.
⏺️ วิธีใช้งาน
🔹 แท่ง Histogram — แสดงคะแนนและสีสถานะจากแท่งที่ปิดล่าสุด
🔹 สีพื้นหลัง — แสดงสถานะที่ยืนยันต่อเนื่องครบจำนวนแท่งปิดที่กำหนด
🔹 สัญลักษณ์ — แสดงจุดที่สถานะยืนยันเปลี่ยน
🔹 Dashboard — แสดงคะแนน Efficiency, Retreat และสถานะยืนยัน
คะแนนที่มีขนาดมากขึ้น หมายถึงการเดินหน้าอย่างมีทิศทางมีประสิทธิภาพมากขึ้นหลังหักการถอยกลับ ไม่ได้หมายความว่าราคาเคลื่อนที่เป็นจำนวนจุดมากขึ้นเสมอไป
คะแนนที่มีขนาดลดลง อาจเกิดจาก Efficiency ลดลง การหักคะแนนจาก Retreat เพิ่มขึ้น หรือทั้งสองอย่าง
สีแท่ง Histogram กับสีพื้นหลังอาจต่างกันชั่วคราวระหว่างรอยืนยันสถานะใหม่
⏺️ Default settings
🔹 Lookback — 20 price changes, using 21 closes
🔹 Minimum Efficiency — 0.30, or 30%
🔹 Retreat Limit — 0.25, or 25% of the closing-price range
🔹 Retreat Penalty Weight — 1.0
🔹 Confirmation — 2 consecutive closed bars
A shorter lookback generally responds more quickly to recent movement. A longer lookback evaluates a broader window.
Increasing the penalty weight reduces the score more strongly for the same retreat. The retreat limit controls the gold classification; the penalty weight controls score reduction.
⏺️ ค่าเริ่มต้น
🔹 Lookback — ระยะเปลี่ยนแปลง 20 ช่วง ใช้ราคาปิด 21 ค่า
🔹 Minimum Efficiency — 0.30 หรือ 30%
🔹 Retreat Limit — 0.25 หรือ 25% ของช่วงราคาปิดสูงสุด–ต่ำสุด
🔹 Retreat Penalty Weight — 1.0
🔹 Confirmation — สถานะต่อเนื่อง 2 แท่งปิด
Lookback สั้นจะตอบสนองต่อการเคลื่อนไหวล่าสุดได้เร็วขึ้น ส่วน Lookback ยาวจะประเมินภาพในกรอบที่กว้างขึ้น
การเพิ่ม Penalty Weight ทำให้หักคะแนนมากขึ้นสำหรับระยะถอยกลับเท่าเดิม โดย Retreat Limit ใช้กำหนดสถานะสีทอง ส่วน Penalty Weight ใช้กำหนดความแรงในการลดคะแนน
⏺️ Alerts
Available alert conditions:
🔹 Efficient up
🔹 Efficient down
🔹 Retreat / rebound
🔹 Chop / flat
🔹 Any confirmed state change
By default, a new state must persist for 2 consecutive closed bars before confirmation. An alert event occurs once when the confirmed state changes.
The first confirmed state initializes the indicator without generating an alert. Upward retreat and downward rebound are tracked as separate states, even though both use gold.
To enable alerts, create an alert in TradingView, select the desired indicator condition, and choose “Once Per Bar Close.”
⏺️ การแจ้งเตือน
เลือกเงื่อนไข Alert ได้ดังนี้:
🔹 Efficient up — ขึ้นอย่างมีประสิทธิภาพ
🔹 Efficient down — ลงอย่างมีประสิทธิภาพ
🔹 Retreat / rebound — ถอยกลับหรือเด้งกลับถึงเกณฑ์
🔹 Chop / flat — แกว่งตัวหรือไม่มีการเปลี่ยนแปลงสุทธิ
🔹 Any confirmed state change — สถานะยืนยันเปลี่ยนทุกประเภท
ค่าเริ่มต้นกำหนดให้สถานะใหม่ต่อเนื่องครบ 2 แท่งปิดก่อนยืนยัน และสร้างเหตุการณ์ Alert ครั้งเดียวเมื่อสถานะยืนยันเปลี่ยน
สถานะแรกที่ยืนยันได้ใช้สำหรับเริ่มต้นระบบ โดยไม่สร้าง Alert ส่วนการถอยในทิศทางขึ้นกับการเด้งในทิศทางลงถือเป็นคนละสถานะ แม้จะแสดงสีทองเหมือนกัน
หากต้องการรับการแจ้งเตือน ให้สร้าง Alert ใน TradingView เลือกเงื่อนไขของ Indicator และตั้งเป็น “Once Per Bar Close”
⏺️ Key Features
🔹 Directional efficiency score from −100 to +100
🔹 Closing-price retreat penalty
🔹 Four color categories with separate upward/downward retreat states
🔹 Configurable closed-bar confirmation
🔹 Dashboard and confirmed-state markers
🔹 Price-only calculation, with no volume requirement
🔹 No future-bar references or multi-timeframe data requests
⏺️ จุดเด่น
🔹 คะแนนประสิทธิภาพการเคลื่อนไหวตั้งแต่ −100 ถึง +100
🔹 หักคะแนนตามการถอยจากจุดสุดขั้วของราคาปิด
🔹 แสดง 4 กลุ่มสี โดยแยกสถานะถอยขาขึ้นกับเด้งขาลงในตรรกะการยืนยัน
🔹 ปรับจำนวนแท่งปิดสำหรับยืนยันสถานะได้
🔹 มี Dashboard และสัญลักษณ์เมื่อสถานะยืนยันเปลี่ยน
🔹 ใช้ข้อมูลราคา โดยไม่ต้องใช้ Volume
🔹 ไม่อ้างอิงแท่งในอนาคตหรือดึงข้อมูลจาก Timeframe อื่น
⏺️ Concept and attribution
The efficiency component is based on Perry Kaufman’s Efficiency Ratio. Trend Mileage extends this foundation with a directional score, a closing-price retreat penalty, and consecutive closed-bar state confirmation.
This implementation was written independently. It does not claim that Efficiency Ratio or the general idea of combining efficiency with drawdown-related measures is new.
Reference:
TradingView — Kaufman’s Adaptive Moving Average (KAMA)
tradingview.com/support/solutions/43000773012-kaufman-s-adaptive-moving-average-kama/
Related conceptual comparison:
Linearity V1.0 by arung0wda

These references acknowledge the underlying concept and related work. They do not imply endorsement or identical calculations.
⏺️ แนวคิดและการอ้างอิง
ส่วนวัด Efficiency ต่อยอดจาก Efficiency Ratio ของ Perry Kaufman โดย Trend Mileage เพิ่มคะแนนแบบมีทิศทาง การหักคะแนนตามระยะถอยจากจุดสุดขั้วของราคาปิด และการยืนยันสถานะด้วยแท่งปิดต่อเนื่อง
โค้ดชุดนี้เขียนขึ้นใหม่ โดยไม่ได้อ้างว่า Efficiency Ratio หรือแนวคิดทั่วไปในการใช้ประสิทธิภาพร่วมกับการวัดการถอยกลับเป็นสิ่งใหม่ทั้งหมด
แหล่งอ้างอิงและงานเปรียบเทียบระบุไว้ด้านบน เพื่อให้เครดิตแนวคิดพื้นฐานและงานที่เกี่ยวข้อง ไม่ได้หมายถึงการรับรองหรือการใช้สูตรเดียวกัน
⏺️ Limitations and disclaimer
🔹 This is a market-condition indicator, not a standalone entry/exit system.
🔹 Scores are not probabilities, expected returns, or performance guarantees.
🔹 Retreat is measured against closing-price extremes in a rolling window. It is not portfolio maximum drawdown and does not include intrabar highs/lows.
🔹 Window changes can affect the score even when the latest price changes only slightly.
🔹 State confirmation introduces delay and cannot eliminate false signals.
🔹 Synthetic formula and state-transition checks have been completed. TradingView compilation and live-market validation remain pending for this version.
🔹 For educational and informational purposes only. It does not constitute investment advice.
⏺️ ข้อจำกัดและคำชี้แจง
🔹 เป็นเครื่องมือประเมินสภาวะราคา ไม่ใช่ระบบ Entry / Exit ที่ใช้ตัดสินใจได้โดยลำพัง
🔹 คะแนนไม่ใช่โอกาสชนะ ผลตอบแทนคาดหวัง หรือการรับประกันผลลัพธ์
🔹 Retreat วัดจากจุดสุดขั้วของราคาปิดในกรอบย้อนหลัง ไม่ใช่ Maximum Drawdown ของพอร์ต และไม่ได้ใช้ High / Low ระหว่างแท่ง
🔹 การเลื่อนกรอบย้อนหลังอาจทำให้คะแนนเปลี่ยน แม้ราคาล่าสุดเปลี่ยนเพียงเล็กน้อย
🔹 การรอยืนยันสถานะทำให้มีความล่าช้า และไม่สามารถกำจัดสัญญาณผิดพลาดทั้งหมด
🔹 เวอร์ชันนี้ตรวจสูตรและการเปลี่ยนสถานะด้วยข้อมูลสังเคราะห์แล้ว แต่ยังรอการ Compile ใน TradingView และตรวจสอบกับข้อมูลตลาดจริง
🔹 ใช้เพื่อการศึกษาและประกอบการวิเคราะห์ ไม่ถือเป็นคำแนะนำการลงทุน
[DAOL] Trend Mileage measures how efficiently price moves in one direction, then reduces its score when price retreats from the closing-price extreme within the selected window.
The idea is simple: if the total distance between consecutive closes is 10 points, but the net advance is only 2 points, price has moved a lot while making relatively little progress.
The indicator combines three elements:
🔹 Efficiency — net price change compared with total close-to-close movement
🔹 Direction — whether the current close is above or below the close N bars ago
🔹 Retreat — how far price has pulled back from the highest close, or rebounded from the lowest close, within the same window
The resulting score ranges from −100 to +100. Its sign indicates direction, while its magnitude represents movement efficiency after the retreat penalty.
⏺️ Indicator นี้คืออะไร?
[DAOL] Trend Mileage คือเครื่องมือวัดว่า ราคาเคลื่อนไหวอย่างมีทิศทางได้มีประสิทธิภาพแค่ไหน แล้วลดคะแนนเมื่อราคาถอยกลับจากจุดสุดขั้วของราคาปิดในช่วงที่กำหนด
หลักการเข้าใจง่าย: หากราคาปิดแต่ละแท่งเดินทางรวม 10 จุด แต่ขึ้นสุทธิเพียง 2 จุด แสดงว่าราคาเคลื่อนไหวมาก แต่เดินหน้าได้น้อย
Indicator ประเมินจาก 3 องค์ประกอบ:
🔹 Efficiency — ระยะเปลี่ยนแปลงสุทธิ เทียบกับระยะเคลื่อนไหวรวมระหว่างราคาปิดแต่ละแท่ง
🔹 Direction — ราคาปิดปัจจุบันสูงหรือต่ำกว่าราคาปิดเมื่อ N แท่งก่อน
🔹 Retreat — ราคาถอยจากราคาปิดสูงสุด หรือเด้งจากราคาปิดต่ำสุดในกรอบเดียวกันมากแค่ไหน
คะแนนอยู่ระหว่าง −100 ถึง +100 โดยเครื่องหมายบอกทิศทาง ส่วนขนาดคะแนนบอกประสิทธิภาพการเคลื่อนไหวหลังหักการถอยกลับ
คะแนนนี้ ไม่ใช่เปอร์เซ็นต์โอกาสชนะ
⏺️ Why use Trend Mileage?
🔹 Distinguishes directional progress from back-and-forth price movement
🔹 Adds context when price remains directional but has already given back part of its move
🔹 Provides a consistent scale for observing changes in market conditions
🔹 Helps complement price action, support/resistance, and other analytical tools
A positive score alone does not confirm an uptrend, and a negative score alone does not confirm a downtrend. Read the score together with efficiency, retreat, and state classification.
⏺️ ทำไมต้องใช้?
🔹 ช่วยแยกการเดินหน้าอย่างมีทิศทาง ออกจากการแกว่งขึ้นลงไปมา
🔹 ช่วยสังเกตว่าราคายังมีทิศทาง แต่คืนระยะที่เคยเดินหน้าไปแล้วมากเพียงใด
🔹 แสดงผลด้วยสเกลเดียวกัน เพื่อให้ติดตามการเปลี่ยนแปลงของสภาวะราคาได้ง่าย
🔹 ใช้ประกอบการอ่าน Price Action แนวรับ/แนวต้าน และเครื่องมือวิเคราะห์อื่น
คะแนนบวกเพียงอย่างเดียวไม่ได้ยืนยันขาขึ้น และคะแนนลบเพียงอย่างเดียวไม่ได้ยืนยันขาลง ควรอ่านร่วมกับค่า Efficiency, Retreat และสีสถานะ
⏺️ Who should use it?
🔹 Traders who want to assess the quality of directional price movement
🔹 Day traders and swing traders monitoring transitions between directional and choppy conditions
🔹 Technical analysts seeking additional context for price action
🔹 Users who prefer a price-only indicator without a volume-data requirement
⏺️ เหมาะกับใคร?
🔹 Trader ที่ต้องการประเมินคุณภาพของการเคลื่อนไหวอย่างมีทิศทาง
🔹 Day trader และ Swing trader ที่ติดตามการเปลี่ยนจากช่วงมีทิศทางไปสู่ช่วงแกว่งตัว
🔹 นักวิเคราะห์ที่ต้องการข้อมูลเพิ่มเติมประกอบการอ่าน Price Action
🔹 ผู้ใช้ที่ต้องการ Indicator จากราคา โดยไม่ต้องอาศัยข้อมูล Volume
⏺️ How is the score calculated?
Net Move = Current Close − Close N bars ago
Total Distance = Sum of absolute close-to-close changes over N bars
Efficiency Ratio = |Net Move| ÷ Total Distance
Retreat Fraction:
Upward net move: (Highest Close − Current Close) ÷ Closing-Price Range
Downward net move: (Current Close − Lowest Close) ÷ Closing-Price Range
Retained Factor = max(0, 1 − Penalty Weight × Retreat Fraction)
Trend Mileage = 100 × Direction × Efficiency Ratio × Retained Factor
Closing-price extremes use N+1 closes, matching the N price changes used in the efficiency calculation.
If all closes are unchanged, the score is zero.
⏺️ คำนวณอย่างไร?
Net Move = ราคาปิดปัจจุบัน − ราคาปิดเมื่อ N แท่งก่อน
Total Distance = ผลรวมระยะเปลี่ยนแปลงระหว่างราคาปิดแต่ละแท่ง โดยไม่คิดเครื่องหมาย
Efficiency Ratio = ค่าสัมบูรณ์ของ Net Move ÷ Total Distance
Retreat Fraction:
ทิศทางขึ้น: ระยะถอยจากราคาปิดสูงสุด ÷ ช่วงราคาปิดสูงสุด–ต่ำสุด
ทิศทางลง: ระยะเด้งจากราคาปิดต่ำสุด ÷ ช่วงราคาปิดสูงสุด–ต่ำสุด
Retained Factor = max(0, 1 − น้ำหนักการหักคะแนน × Retreat Fraction)
Trend Mileage = 100 × ทิศทาง × Efficiency Ratio × Retained Factor
ใช้ราคาปิด N+1 ค่า เพื่อให้ครอบคลุมระยะเปลี่ยนแปลง N ช่วงอย่างสอดคล้องกัน
หากราคาปิดทั้งหมดไม่เปลี่ยนแปลง คะแนนจะเป็นศูนย์
⏺️ How to read the colors
🟢 Green — positive net movement, efficiency meets the threshold, and retreat remains below the limit
🔴 Red — negative net movement, efficiency meets the threshold, and rebound remains below the limit
🟡 Gold — efficiency meets the threshold, but the pullback or rebound has reached the retreat limit
⚪ Gray — efficiency is below the threshold, or there is no net price change
Colors are classified using efficiency, direction, and retreat—not fixed score bands. A gold bar can appear above or below zero.
⏺️ อ่านสีอย่างไร?
🟢 เขียว — ราคาเปลี่ยนแปลงสุทธิเป็นบวก มี Efficiency ผ่านเกณฑ์ และยังถอยจากราคาปิดสูงสุดไม่ถึงเกณฑ์ที่กำหนด
🔴 แดง — ราคาเปลี่ยนแปลงสุทธิเป็นลบ มี Efficiency ผ่านเกณฑ์ และยังเด้งจากราคาปิดต่ำสุดไม่ถึงเกณฑ์ที่กำหนด
🟡 ทอง — มี Efficiency ผ่านเกณฑ์ แต่ถอยกลับหรือเด้งกลับถึงเกณฑ์ที่กำหนดแล้ว
⚪ เทา — Efficiency ต่ำกว่าเกณฑ์ หรือราคาไม่มีการเปลี่ยนแปลงสุทธิ
สีพิจารณาจาก Efficiency ทิศทาง และ Retreat ไม่ได้แบ่งตามช่วงคะแนนตายตัว สีทองจึงปรากฏได้ทั้งเหนือและใต้เส้นศูนย์
⏺️ How to use
🔹 Histogram — displays the latest closed-bar score and its classification
🔹 Background — displays the confirmed state after the required number of consecutive closed bars
🔹 Markers — identify changes in the confirmed state
🔹 Dashboard — displays score, efficiency, retreat, and confirmed state
A larger absolute score indicates more efficient directional progress with a smaller retreat penalty. It does not necessarily indicate a larger price move.
A shrinking absolute score may reflect lower efficiency, a larger retreat penalty, or both.
The histogram and background may temporarily differ while a new state is waiting for confirmation.
⏺️ วิธีใช้งาน
🔹 แท่ง Histogram — แสดงคะแนนและสีสถานะจากแท่งที่ปิดล่าสุด
🔹 สีพื้นหลัง — แสดงสถานะที่ยืนยันต่อเนื่องครบจำนวนแท่งปิดที่กำหนด
🔹 สัญลักษณ์ — แสดงจุดที่สถานะยืนยันเปลี่ยน
🔹 Dashboard — แสดงคะแนน Efficiency, Retreat และสถานะยืนยัน
คะแนนที่มีขนาดมากขึ้น หมายถึงการเดินหน้าอย่างมีทิศทางมีประสิทธิภาพมากขึ้นหลังหักการถอยกลับ ไม่ได้หมายความว่าราคาเคลื่อนที่เป็นจำนวนจุดมากขึ้นเสมอไป
คะแนนที่มีขนาดลดลง อาจเกิดจาก Efficiency ลดลง การหักคะแนนจาก Retreat เพิ่มขึ้น หรือทั้งสองอย่าง
สีแท่ง Histogram กับสีพื้นหลังอาจต่างกันชั่วคราวระหว่างรอยืนยันสถานะใหม่
⏺️ Default settings
🔹 Lookback — 20 price changes, using 21 closes
🔹 Minimum Efficiency — 0.30, or 30%
🔹 Retreat Limit — 0.25, or 25% of the closing-price range
🔹 Retreat Penalty Weight — 1.0
🔹 Confirmation — 2 consecutive closed bars
A shorter lookback generally responds more quickly to recent movement. A longer lookback evaluates a broader window.
Increasing the penalty weight reduces the score more strongly for the same retreat. The retreat limit controls the gold classification; the penalty weight controls score reduction.
⏺️ ค่าเริ่มต้น
🔹 Lookback — ระยะเปลี่ยนแปลง 20 ช่วง ใช้ราคาปิด 21 ค่า
🔹 Minimum Efficiency — 0.30 หรือ 30%
🔹 Retreat Limit — 0.25 หรือ 25% ของช่วงราคาปิดสูงสุด–ต่ำสุด
🔹 Retreat Penalty Weight — 1.0
🔹 Confirmation — สถานะต่อเนื่อง 2 แท่งปิด
Lookback สั้นจะตอบสนองต่อการเคลื่อนไหวล่าสุดได้เร็วขึ้น ส่วน Lookback ยาวจะประเมินภาพในกรอบที่กว้างขึ้น
การเพิ่ม Penalty Weight ทำให้หักคะแนนมากขึ้นสำหรับระยะถอยกลับเท่าเดิม โดย Retreat Limit ใช้กำหนดสถานะสีทอง ส่วน Penalty Weight ใช้กำหนดความแรงในการลดคะแนน
⏺️ Alerts
Available alert conditions:
🔹 Efficient up
🔹 Efficient down
🔹 Retreat / rebound
🔹 Chop / flat
🔹 Any confirmed state change
By default, a new state must persist for 2 consecutive closed bars before confirmation. An alert event occurs once when the confirmed state changes.
The first confirmed state initializes the indicator without generating an alert. Upward retreat and downward rebound are tracked as separate states, even though both use gold.
To enable alerts, create an alert in TradingView, select the desired indicator condition, and choose “Once Per Bar Close.”
⏺️ การแจ้งเตือน
เลือกเงื่อนไข Alert ได้ดังนี้:
🔹 Efficient up — ขึ้นอย่างมีประสิทธิภาพ
🔹 Efficient down — ลงอย่างมีประสิทธิภาพ
🔹 Retreat / rebound — ถอยกลับหรือเด้งกลับถึงเกณฑ์
🔹 Chop / flat — แกว่งตัวหรือไม่มีการเปลี่ยนแปลงสุทธิ
🔹 Any confirmed state change — สถานะยืนยันเปลี่ยนทุกประเภท
ค่าเริ่มต้นกำหนดให้สถานะใหม่ต่อเนื่องครบ 2 แท่งปิดก่อนยืนยัน และสร้างเหตุการณ์ Alert ครั้งเดียวเมื่อสถานะยืนยันเปลี่ยน
สถานะแรกที่ยืนยันได้ใช้สำหรับเริ่มต้นระบบ โดยไม่สร้าง Alert ส่วนการถอยในทิศทางขึ้นกับการเด้งในทิศทางลงถือเป็นคนละสถานะ แม้จะแสดงสีทองเหมือนกัน
หากต้องการรับการแจ้งเตือน ให้สร้าง Alert ใน TradingView เลือกเงื่อนไขของ Indicator และตั้งเป็น “Once Per Bar Close”
⏺️ Key Features
🔹 Directional efficiency score from −100 to +100
🔹 Closing-price retreat penalty
🔹 Four color categories with separate upward/downward retreat states
🔹 Configurable closed-bar confirmation
🔹 Dashboard and confirmed-state markers
🔹 Price-only calculation, with no volume requirement
🔹 No future-bar references or multi-timeframe data requests
⏺️ จุดเด่น
🔹 คะแนนประสิทธิภาพการเคลื่อนไหวตั้งแต่ −100 ถึง +100
🔹 หักคะแนนตามการถอยจากจุดสุดขั้วของราคาปิด
🔹 แสดง 4 กลุ่มสี โดยแยกสถานะถอยขาขึ้นกับเด้งขาลงในตรรกะการยืนยัน
🔹 ปรับจำนวนแท่งปิดสำหรับยืนยันสถานะได้
🔹 มี Dashboard และสัญลักษณ์เมื่อสถานะยืนยันเปลี่ยน
🔹 ใช้ข้อมูลราคา โดยไม่ต้องใช้ Volume
🔹 ไม่อ้างอิงแท่งในอนาคตหรือดึงข้อมูลจาก Timeframe อื่น
⏺️ Concept and attribution
The efficiency component is based on Perry Kaufman’s Efficiency Ratio. Trend Mileage extends this foundation with a directional score, a closing-price retreat penalty, and consecutive closed-bar state confirmation.
This implementation was written independently. It does not claim that Efficiency Ratio or the general idea of combining efficiency with drawdown-related measures is new.
Reference:
TradingView — Kaufman’s Adaptive Moving Average (KAMA)
tradingview.com/support/solutions/43000773012-kaufman-s-adaptive-moving-average-kama/
Related conceptual comparison:
Linearity V1.0 by arung0wda
These references acknowledge the underlying concept and related work. They do not imply endorsement or identical calculations.
⏺️ แนวคิดและการอ้างอิง
ส่วนวัด Efficiency ต่อยอดจาก Efficiency Ratio ของ Perry Kaufman โดย Trend Mileage เพิ่มคะแนนแบบมีทิศทาง การหักคะแนนตามระยะถอยจากจุดสุดขั้วของราคาปิด และการยืนยันสถานะด้วยแท่งปิดต่อเนื่อง
โค้ดชุดนี้เขียนขึ้นใหม่ โดยไม่ได้อ้างว่า Efficiency Ratio หรือแนวคิดทั่วไปในการใช้ประสิทธิภาพร่วมกับการวัดการถอยกลับเป็นสิ่งใหม่ทั้งหมด
แหล่งอ้างอิงและงานเปรียบเทียบระบุไว้ด้านบน เพื่อให้เครดิตแนวคิดพื้นฐานและงานที่เกี่ยวข้อง ไม่ได้หมายถึงการรับรองหรือการใช้สูตรเดียวกัน
⏺️ Limitations and disclaimer
🔹 This is a market-condition indicator, not a standalone entry/exit system.
🔹 Scores are not probabilities, expected returns, or performance guarantees.
🔹 Retreat is measured against closing-price extremes in a rolling window. It is not portfolio maximum drawdown and does not include intrabar highs/lows.
🔹 Window changes can affect the score even when the latest price changes only slightly.
🔹 State confirmation introduces delay and cannot eliminate false signals.
🔹 Synthetic formula and state-transition checks have been completed. TradingView compilation and live-market validation remain pending for this version.
🔹 For educational and informational purposes only. It does not constitute investment advice.
⏺️ ข้อจำกัดและคำชี้แจง
🔹 เป็นเครื่องมือประเมินสภาวะราคา ไม่ใช่ระบบ Entry / Exit ที่ใช้ตัดสินใจได้โดยลำพัง
🔹 คะแนนไม่ใช่โอกาสชนะ ผลตอบแทนคาดหวัง หรือการรับประกันผลลัพธ์
🔹 Retreat วัดจากจุดสุดขั้วของราคาปิดในกรอบย้อนหลัง ไม่ใช่ Maximum Drawdown ของพอร์ต และไม่ได้ใช้ High / Low ระหว่างแท่ง
🔹 การเลื่อนกรอบย้อนหลังอาจทำให้คะแนนเปลี่ยน แม้ราคาล่าสุดเปลี่ยนเพียงเล็กน้อย
🔹 การรอยืนยันสถานะทำให้มีความล่าช้า และไม่สามารถกำจัดสัญญาณผิดพลาดทั้งหมด
🔹 เวอร์ชันนี้ตรวจสูตรและการเปลี่ยนสถานะด้วยข้อมูลสังเคราะห์แล้ว แต่ยังรอการ Compile ใน TradingView และตรวจสอบกับข้อมูลตลาดจริง
🔹 ใช้เพื่อการศึกษาและประกอบการวิเคราะห์ ไม่ถือเป็นคำแนะนำการลงทุน

Disclaimer
The information and publications are not meant to be, and do not constitute, financial, investment, trading, or other types of advice or recommendations supplied or endorsed by TradingView. Read more in the Terms of Use.
Disclaimer
The information and publications are not meant to be, and do not constitute, financial, investment, trading, or other types of advice or recommendations supplied or endorsed by TradingView. Read more in the Terms of Use.